
Hi, Readers.
The public preview for Dynamics 365 Business Central 2023 release wave 2 (BC23) is available. Learn more: Link.
I will continue to test and share some new features that I hope will be helpful.
Choose between more sampling intervals for snapshot and in-client profiling:
Business value:
Some releases ago we introduced a great new tool to investigate AL performance, namely profiling—either as the AL profiler for developers in a snapshot debug session from within Visual Studio Code, or as part of the in-client performance profiler accessible to customer admins and consultants as well as developers.In the in-client performance profiler, and optionally in the AL profiler, sampling is used to determine at what intervals the system monitors what is running. At launch we supported 100ms sampling interval only. Based on feedback we are now allowing the user to choose between 50, 100 and 150ms. This allows for both finer and coarser granularity of insights, for example, to catch smaller operations and get more accurate durations, or to limit dates being captured and displayed to larger operations only.
https://learn.microsoft.com/en-us/dynamics365/release-plan/2023wave2/smb/dynamics365-business-central/choose-between-more-sampling-intervals-snapshot-in-client-profiling
In Business Central 2021 wave 2 (BC19), Micorosft added the AL performance profiler to the Visual Studio Code AL experience. This feature is mainly for developers. The performance profiler has empowered pro developers to investigate performance as part of developing new functionality. More details: Profiling AL performance with snapshot debugger (AL: Generate profile file)
Test video:
In Business Central 2022 wave 1 (BC20), Microsoft was going to take this even further. The in-client performance profiler feature is available. Any user with permission can analyze performance issues in Business Central.

Test video:
| Performance tool | Properties |
|---|---|
| Page inspector | Good to troubleshoot performance of a single page. No need to enable this (always available). End users can run the tool. Data collection must happen live. |
| In-client performance profiler | Good for troubleshooting a performance scenario in the web client. No developer required to run the tool. For more information, see In-client Performance Profiler overview. |
| Telemetry | Can be used if you want to investigate things after they happened. Good for analyzing patterns across sessions. Extensive resources available (Power BI report, Jupyter notebooks, sample KQL queries). Little performance impact to have turned on always. Telemetry must be enabled before the performance issue occurs. Not every single AL call is logged to telemetry as this would slow down the Business Central server. |
| Verbose telemetry | Will give you all SQL queries for the session where you repro the issue. Will slow down the system while running. Can inject much data into Azure Application Insights. Data collection must happen live. |
| Database performance pages | The pages Database Missing Indexes and Database Wait Statistics show insights into database performance and how to fix it. |
| AL profiler | Good to troubleshoot performance of a scenario. Detailed information on where in the code the time is spent. No need to enable this (always available). Requires a developer to run the tool. Data collection must happen live. For more information, see AL Profiler |
As Microsoft mentioned above, in both of these features, sampling is used to determine at what intervals the system monitors what is running. Microsoft supported 100ms sampling interval only. In this wave, Microsoft has added new settings that allow users to choose between 50, 100 and 150ms.
Let’s see more details.
AL profiler: With the launch.json snapshot configuration parameter profileSamplingInterval, AL developers can specify the interval at which the sampling will be collected. Current options are {50ms, 100ms, 150ms}. The default value is 100ms.
“profileSamplingInterval”
Specifies the sampling interval in milliseconds when “Sampling” profiling type is specified. Default is 100ms.


In-client performance profiler: In the in-client performance profiler, there is a new Settings action, where you can select the same sampling internal options. Again, 100ms is the default.

Choose the sampling interval of the performance profiler. Smaller intervals will result in more precise timings, but it might result in higher load of the system.

PS: In previous versions

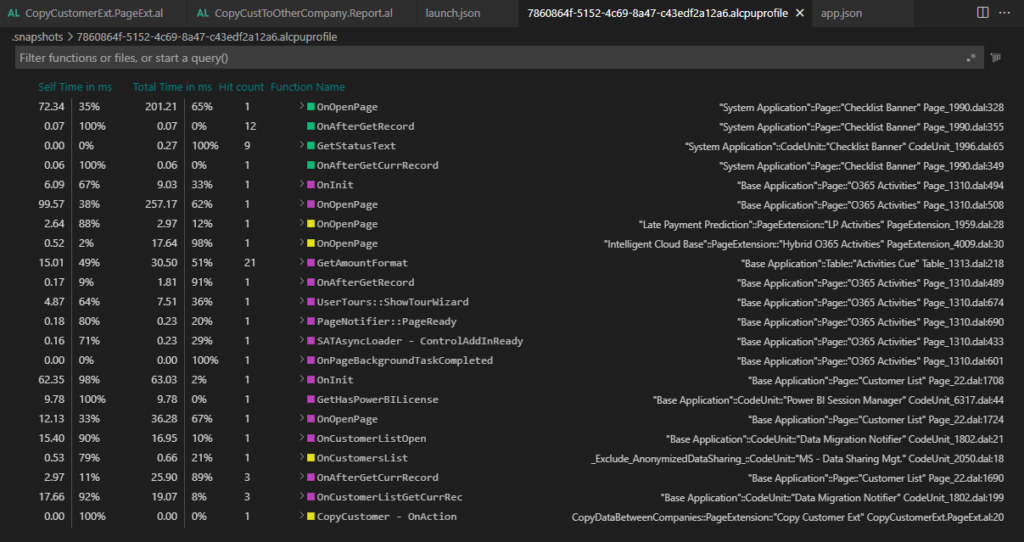
Let’s take a brief look at the difference between 50ms and 150ms, the same is to post a Sales Order with only one line of item (There may be a little difference in operation).
50ms:

150ms:

Great. Give it a try!!!😁
END
Hope this will help.
Thanks for reading.
ZHU

コメント