Hi, Readers.
The preview environment for Dynamics 365 Business Central 2021 release wave 2 (BC19) is available now. Learn more: https://yzhums.com/17638/
Update: Generally available: Dynamics 365 Business Central 2021 release wave 2 (BC19)
I will continue to test and share some new features that I hope will be helpful.
Profiling AL performance with snapshot debugger:
Business value:
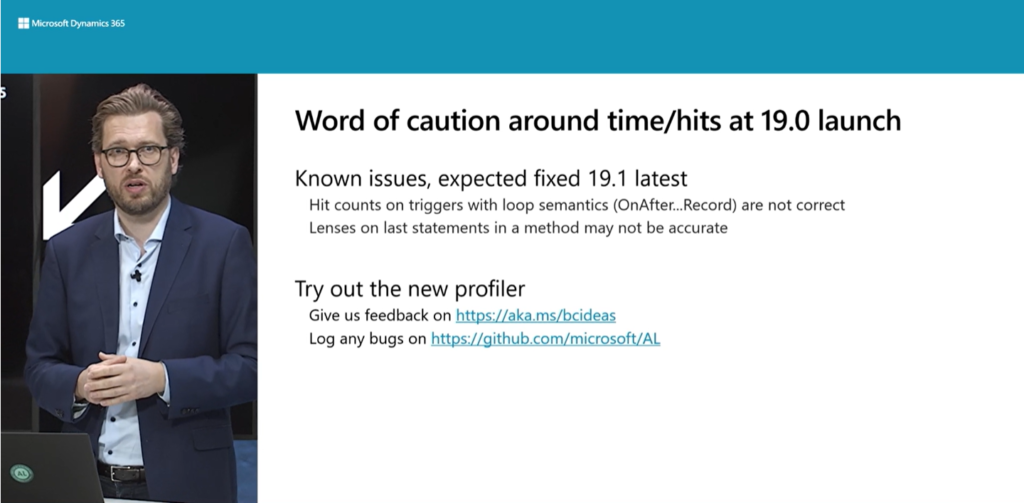
Performance is top of mind for most customers, especially in the world of online business. Until now, apart from selected, reactive telemetry allowing monitoring of customer tenants, there has not been a proactive way to measure execution performance during development nor when troubleshooting specific customer support cases with performance issues. To address this, we are introducing the ability to capture execution timing as part of a snapshot, and investigate this in Visual Studio Code when replaying the snapshot.
Feature details:
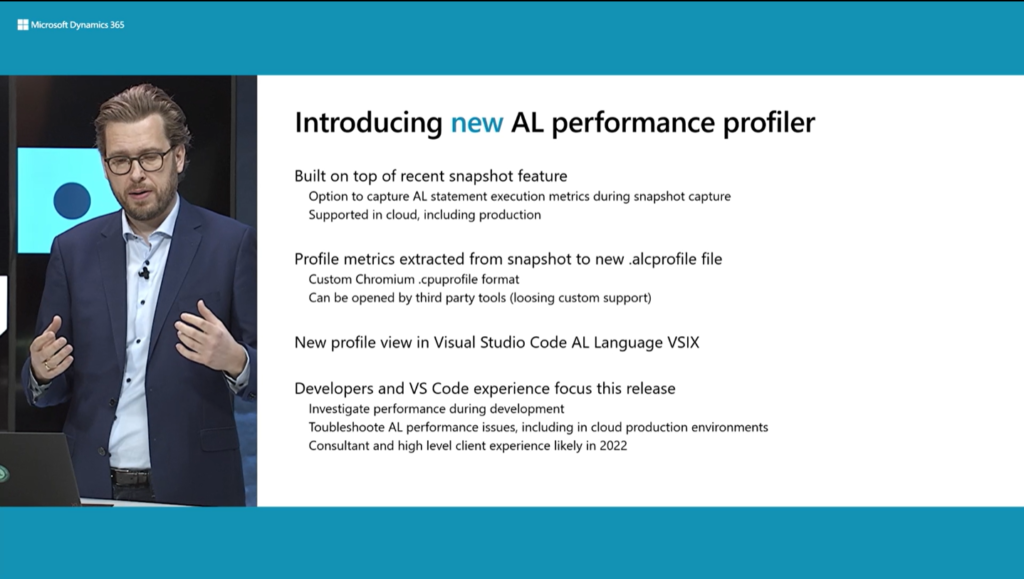
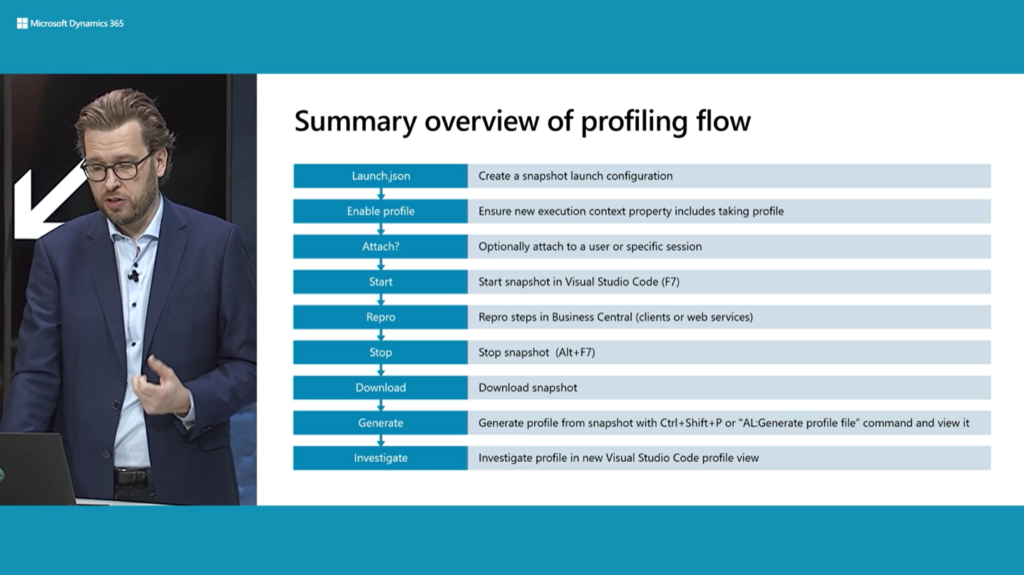
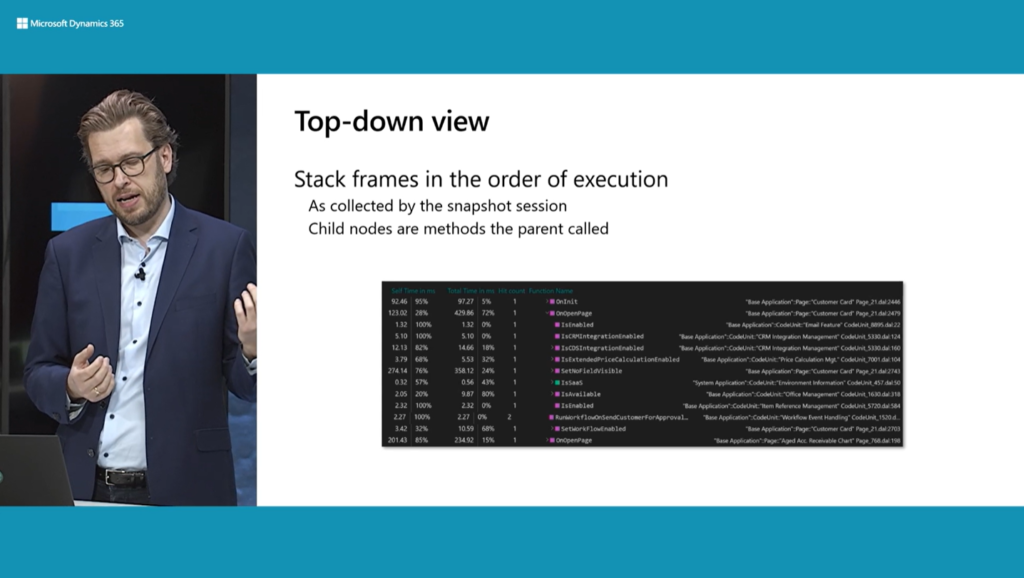
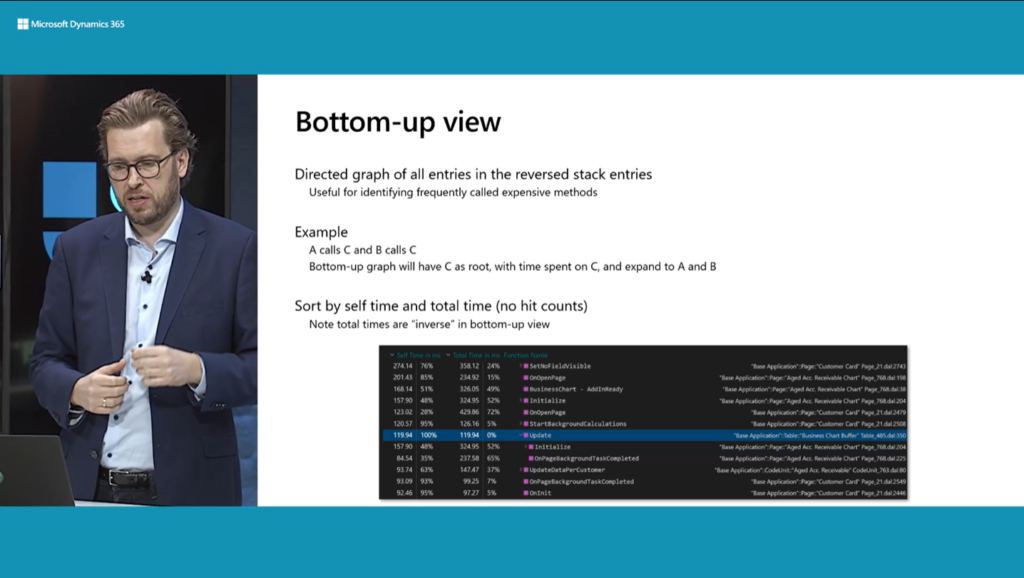
Snapshot captures now include a performance profile of the executed code that is captured in the snapshot. Using a new performance profiling editor view in the AL Visual Studio Code extension, developers can then investigate the time spent on execution, either using top-down or bottom-up call stack views.
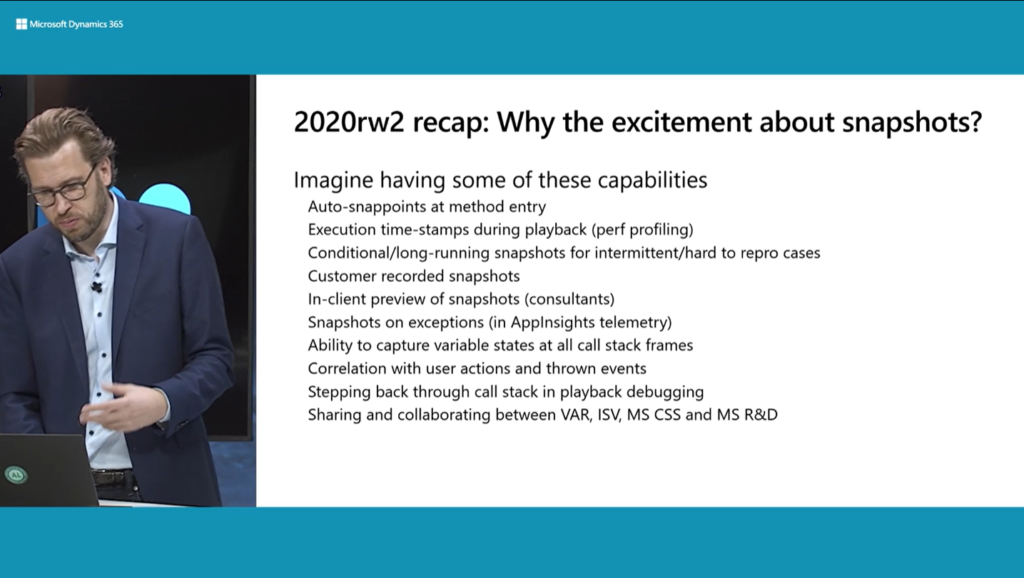
A few months ago, we talked about Snapshot Debugging (Debugging in Cloud Production) in Business Central. (You can find more information in that post.)
For example:
From BC19, snapshot captures now include a performance profile of the executed code that is captured in the snapshot.
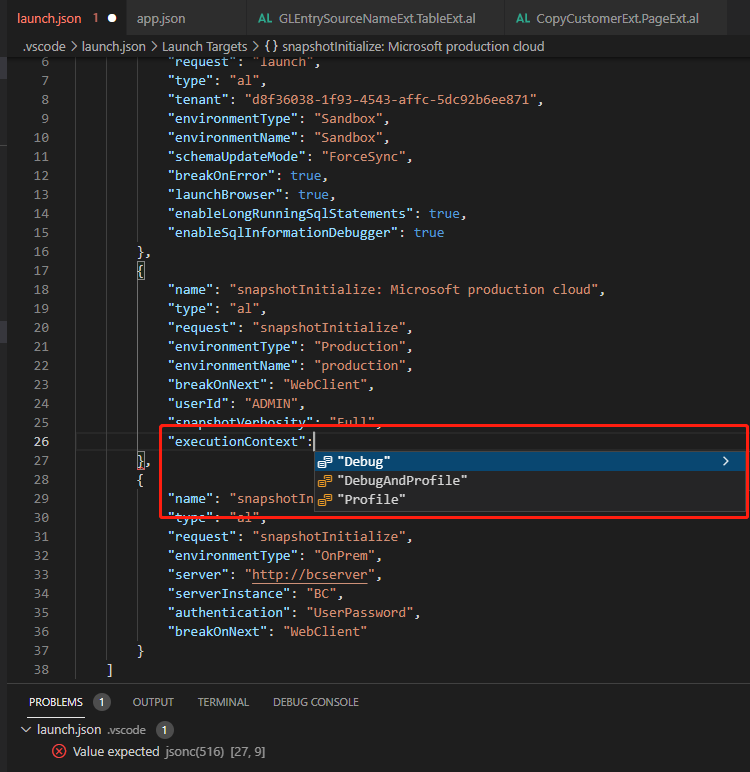
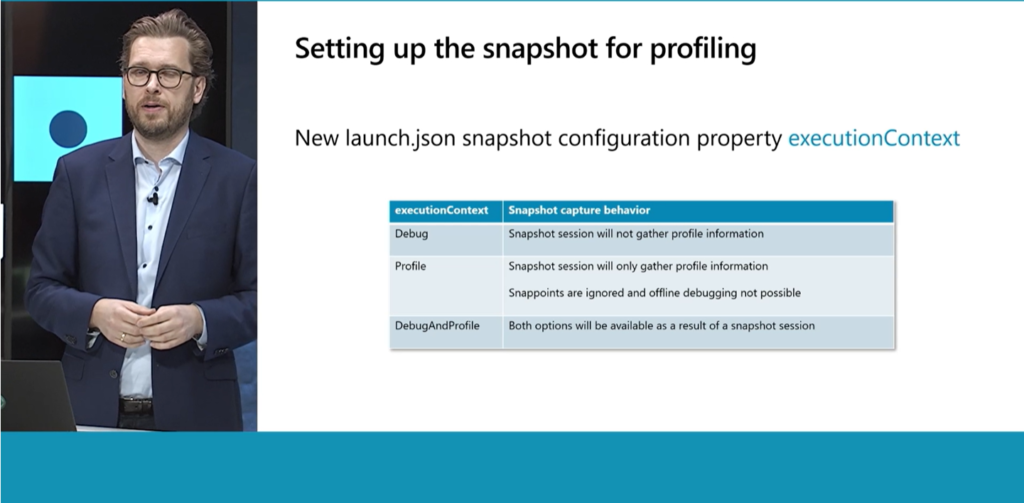
A new setting have been added in launch.json.
“executionContext”: Specifies how the snapshot technology will be applied on the Buseiness Central server executing AL code
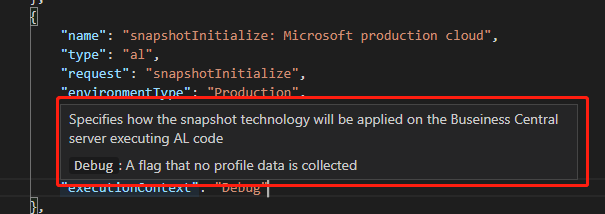
Debug: A flag that no profile data is collectedDebugAndProfile: Both debugging and profiling is performedProfile: A flag that only a profiling session is performed, snappoints will be ignored.
In this post, I will not explain in detail how to use Snapshot Debugging. If necessary, you can refer to this blog: Snapshot Debugging (Debugging in Cloud Production).
After the snapshot file download is complete.
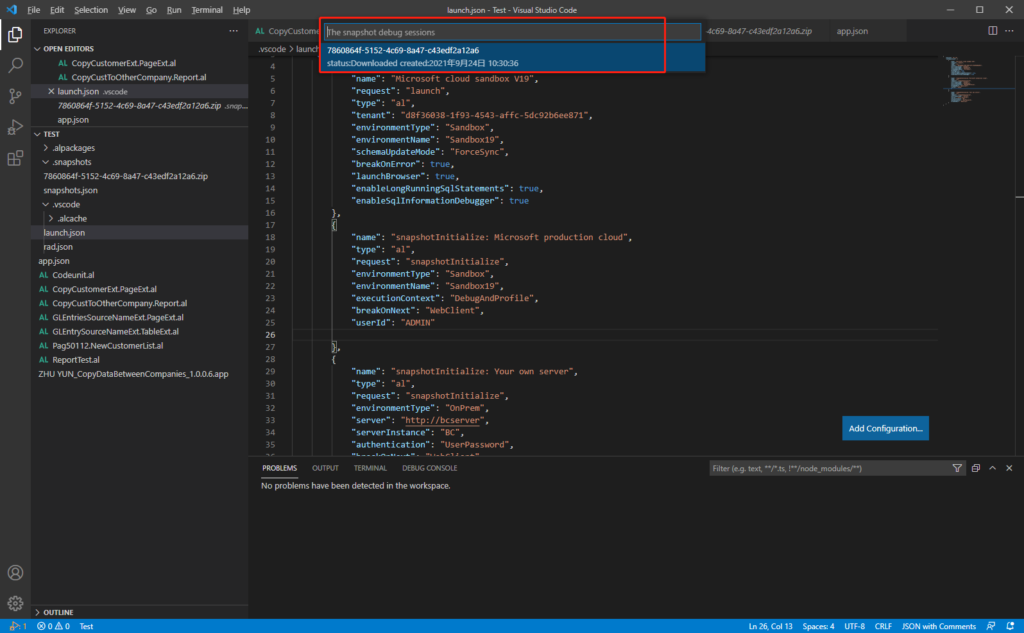
Now you can run AL: Generate profile file command.
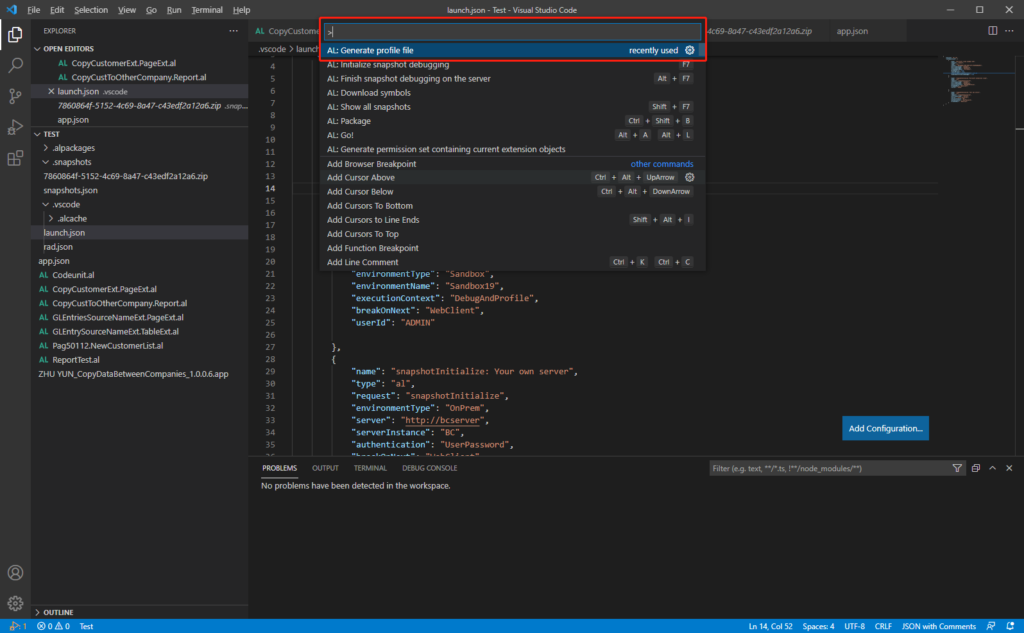
Choose the downloaded snapshot file.

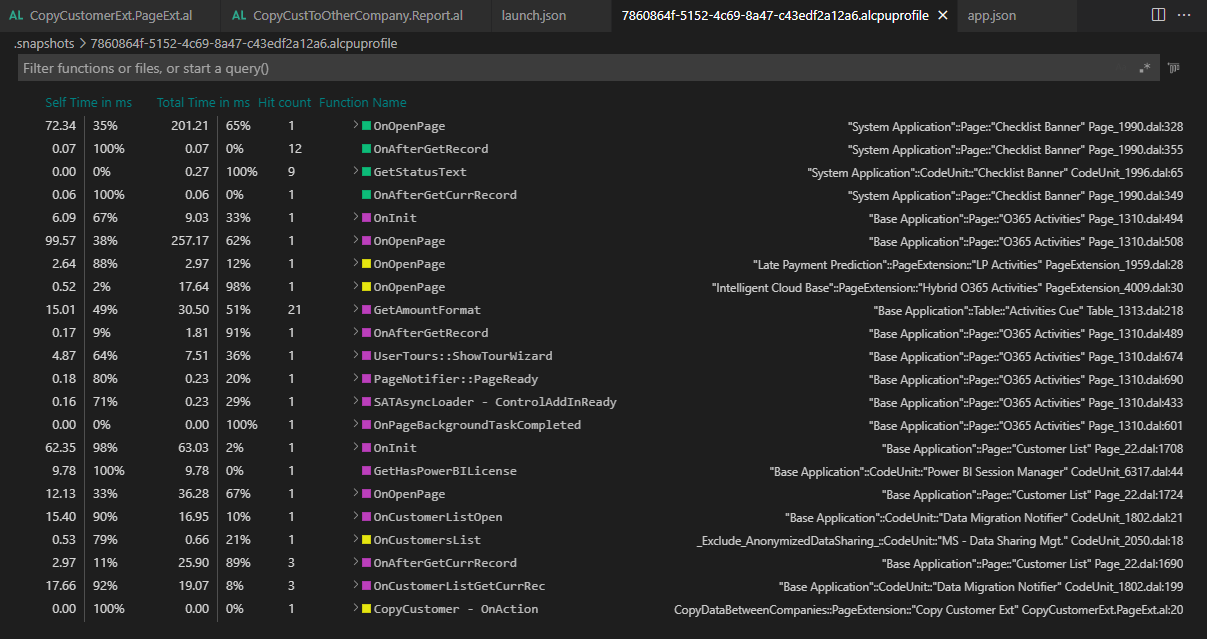
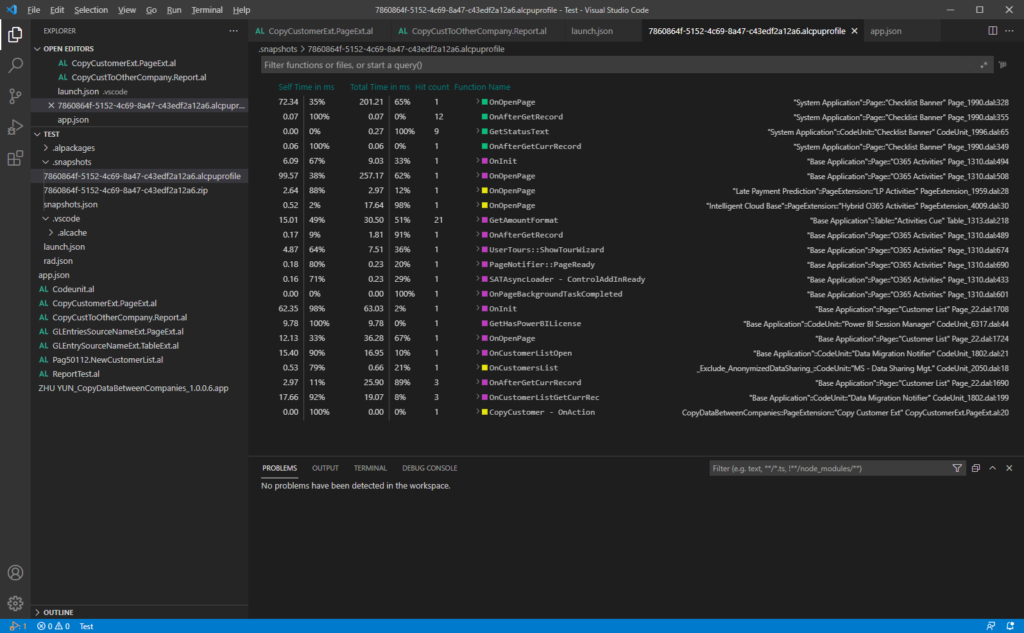
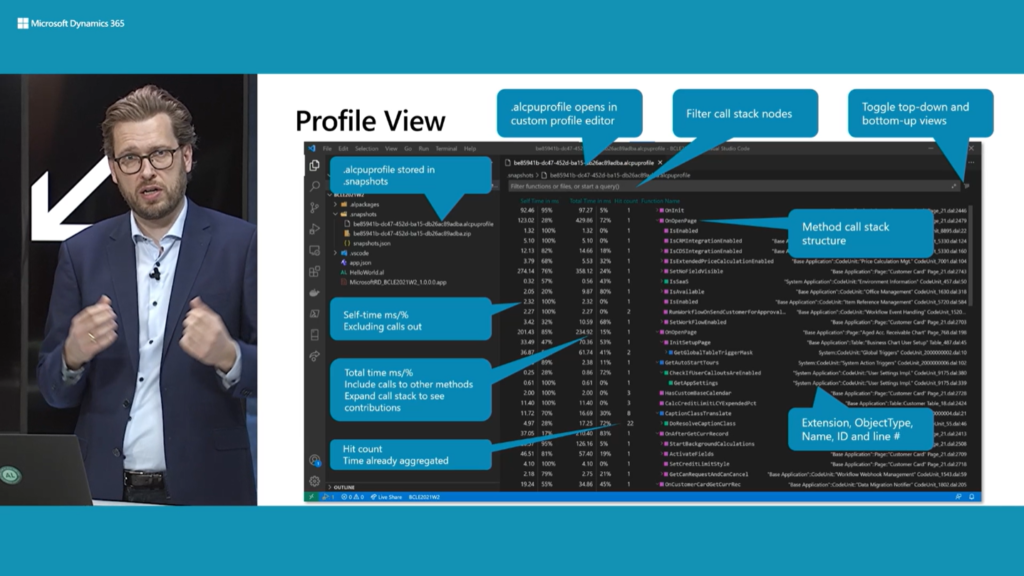
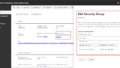
Then the performance profile file will be downloaded and opened.
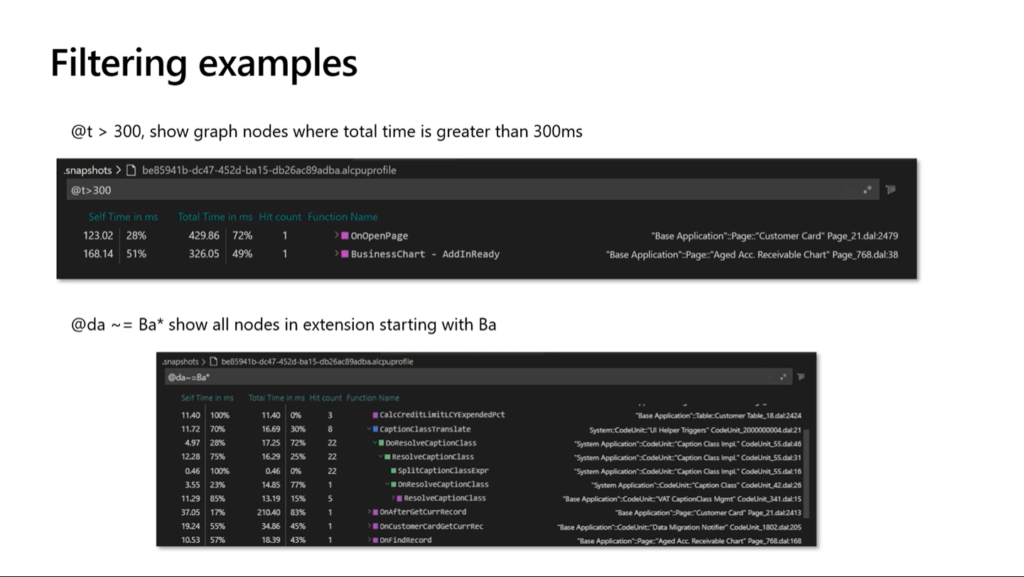
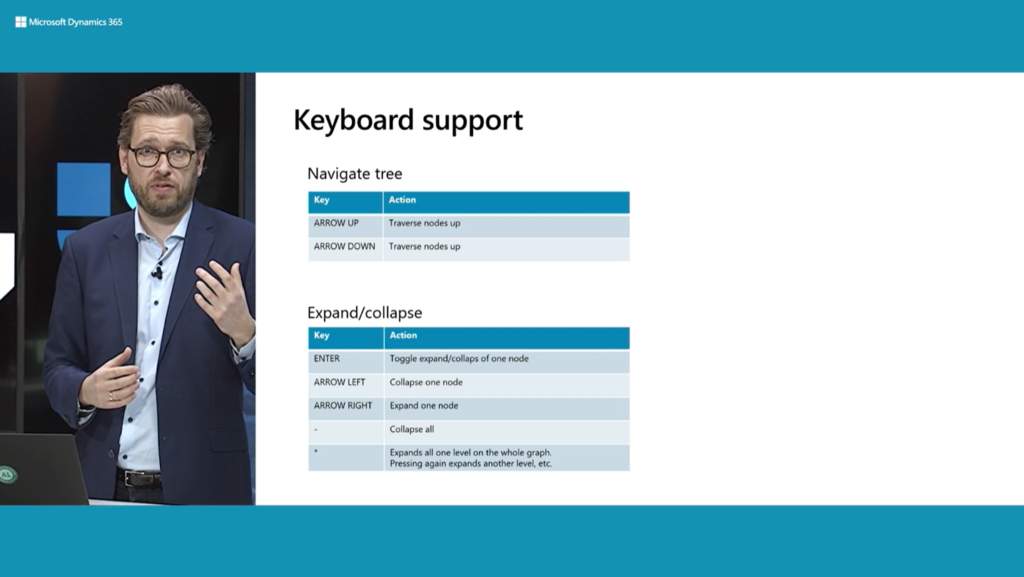
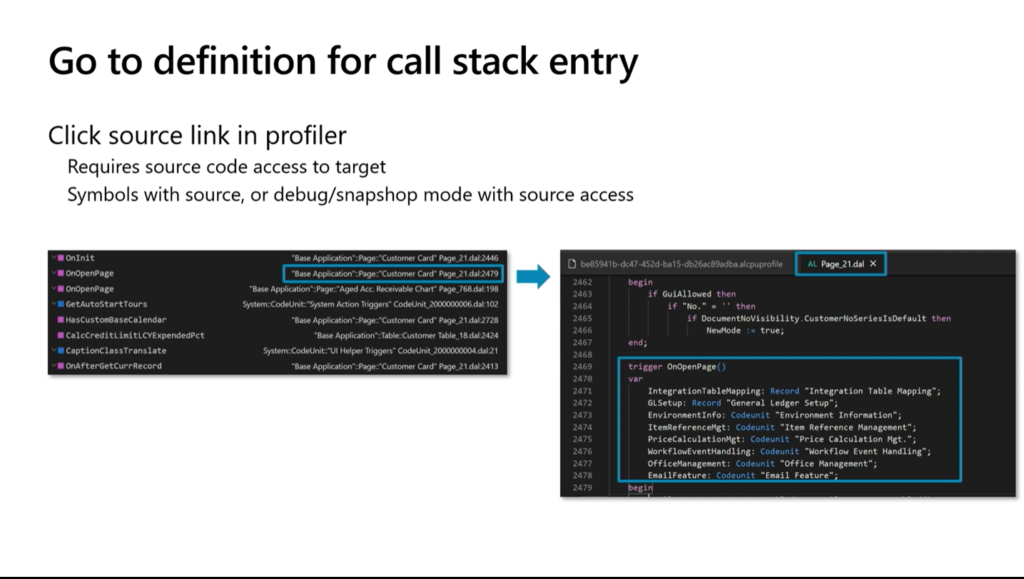
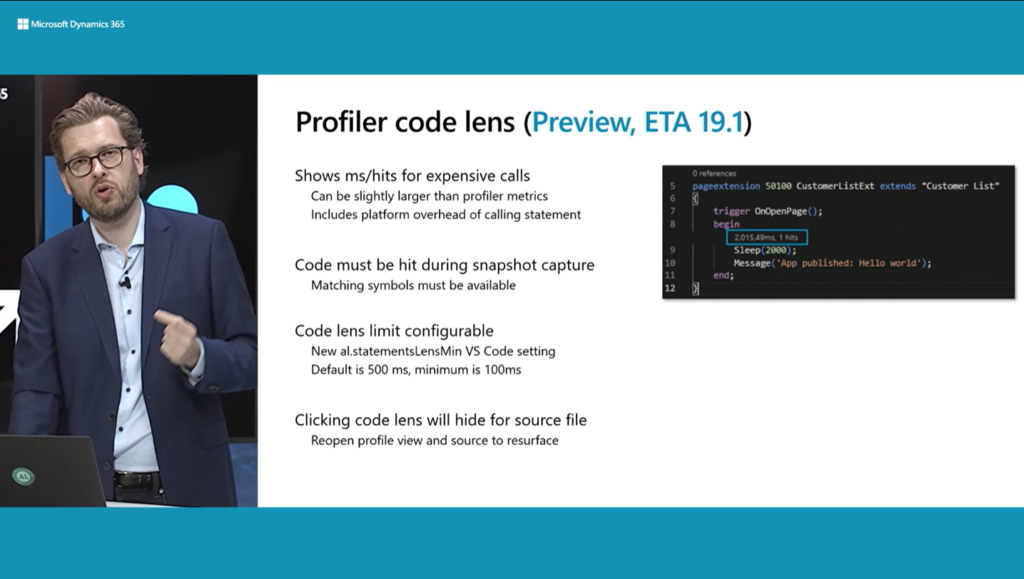
You can trace the execution of triggers, events, procedures and etc. in this new performance profiling editor view.
Test Video:
This is a very nice feature to find performance issues in the Production Environment, give it a try.
Update 2021/11/10: Info from Microsoft
END
Hope this will help.
Thanks for reading.
ZHU
コメント