Hi, Readers.
The preview environment for Dynamics 365 Business Central 2022 release wave 1 (BC20) is available. Learn more: Link
I will continue to test and share some new features that I hope will be helpful.
In-client performance profiler:
Business value:
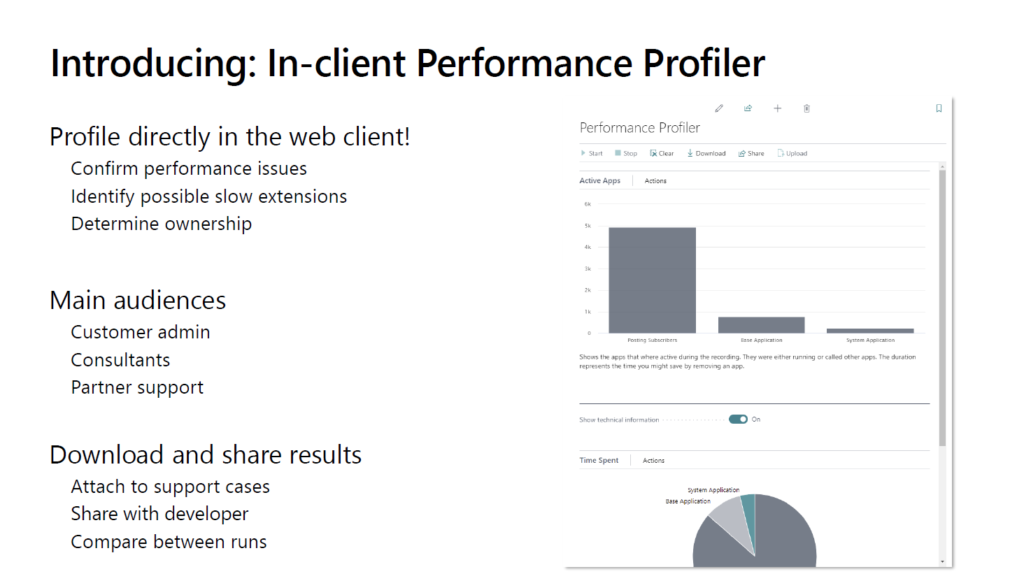
In 2022 release wave 1, we add new capabilities to the AL performance profiler. In this release wave, we are going to empower functional developers/consultants, as well as customer administrators and power users to capture a user flow from within the web client, and view high-level information about time spent in the web client. This way, people can investigate which involved extensions consume the most time, including top-consuming method calls, for example.
Feature details:
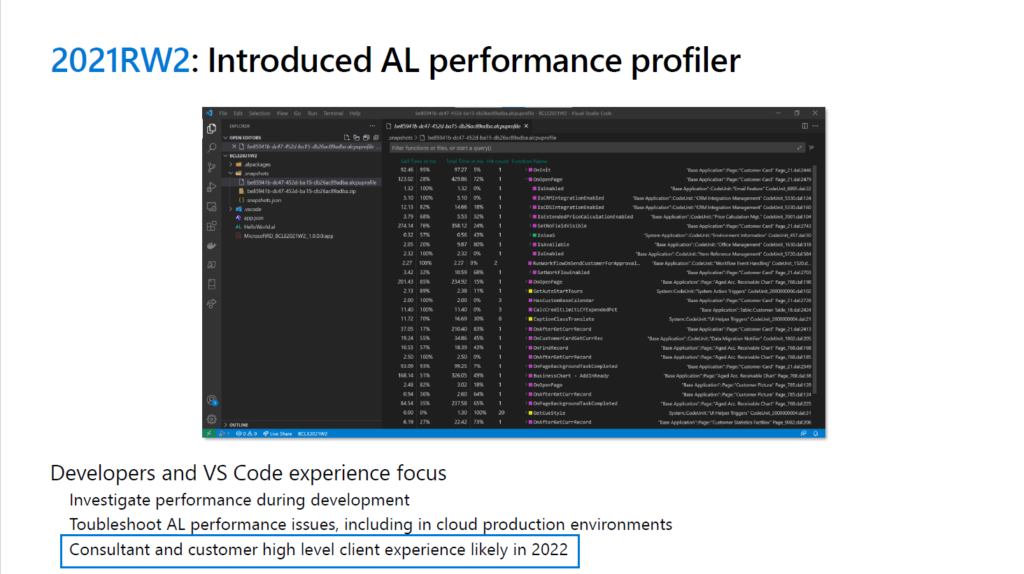
In 2021 release wave 2, we added the AL performance profiler to the Visual Studio Code AL experience. The performance profiler has empowered pro developers to investigate performance as part of developing new functionality, as well as help troubleshoot performance issues in AL code in customer environments, even in production.In 2022 release wave 1, we are going to take this even further. Having this tool will make it easy for consultants and customer administrators to seamlessly perform initial performance investigations without involving pro developers, to be able to pinpoint performance issues and file support cases to the most likely owners of the app, be that a per-tenant extension, an AppSource app, or the Dynamics 365 Business Central core app. It will also be possible to share the resulting capture, making it faster for a pro developer to do further analysis without having to perform a repro of the issue locally.
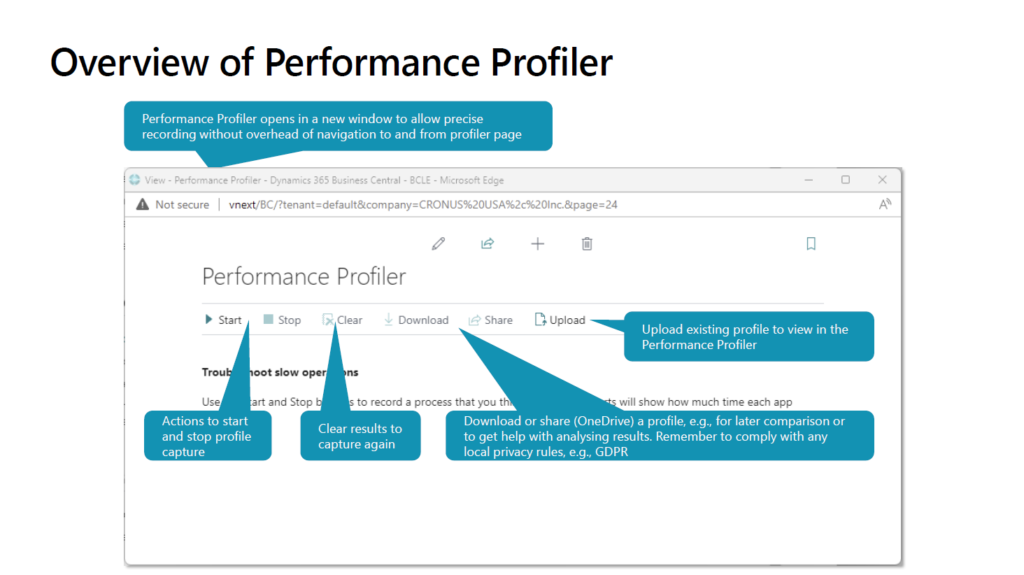
The in-client performance profiler will be a new app page that can be reached on its own or from the Help & Support page. It will contain actions to start and stop the capture of a user flow. You will be able to see the performance results of a capture, including time spent per involved extension, top method calls, and other metrics. You’ll also be able to download the capture so that you can share it with technical support or a pro developer. Note that the rules of GDPR apply to this. The page can be opened in another browser window side-by-side with the user experience that you want to profile so that you can make sure the capture is as concise as possible and only contains the relevant steps. In this release wave, it will only be possible to capture the current session for the user who starts the profiler.
https://docs.microsoft.com/en-us/dynamics365-release-plan/2022wave1/smb/dynamics365-business-central/in-client-performance-profiler
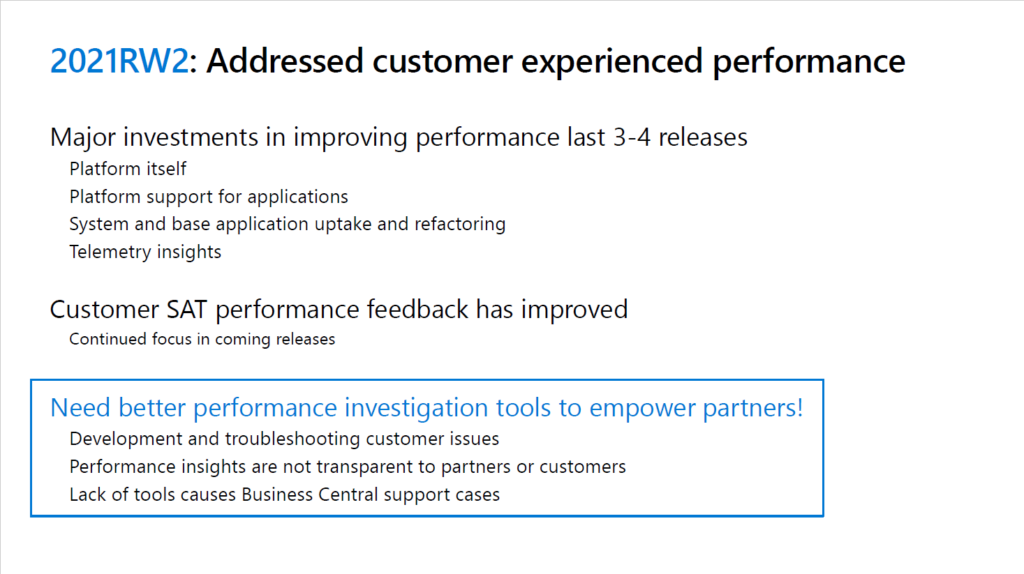
In Business Central 2021 wave 2 (BC19), Micorosft added the AL performance profiler to the Visual Studio Code AL experience. This feature is mainly for developers. The performance profiler has empowered pro developers to investigate performance as part of developing new functionality.
More details: Profiling AL performance with snapshot debugger (AL: Generate profile file)
In Business Central 2022 wave 1 (BC20), Microsoft are going to take this even further. The in-client performance profiler feature is available. Any user with permission can analyze performance issues in Business Central.
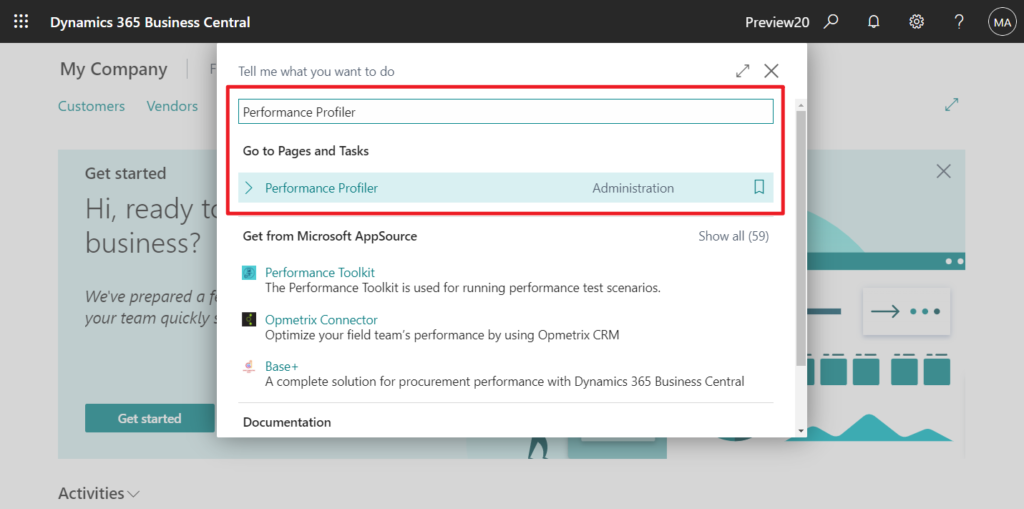
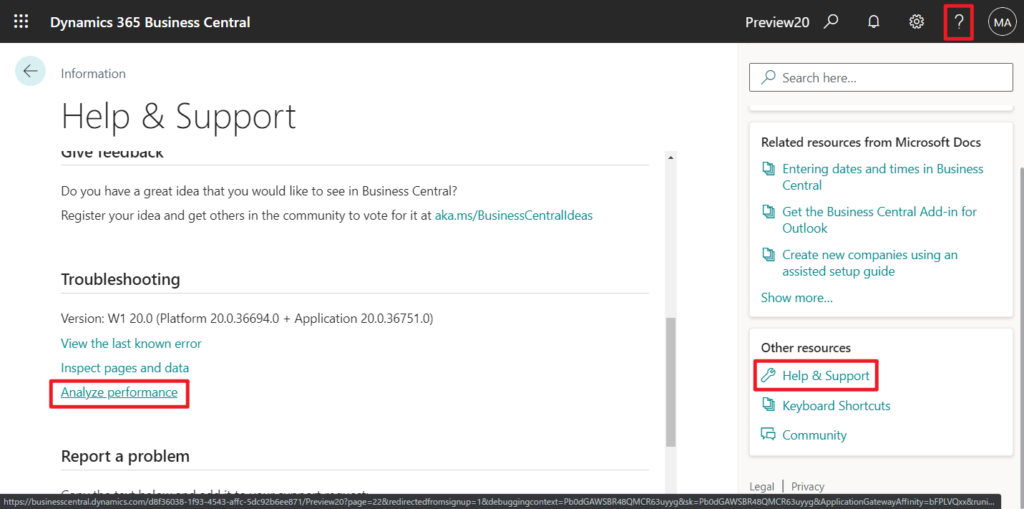
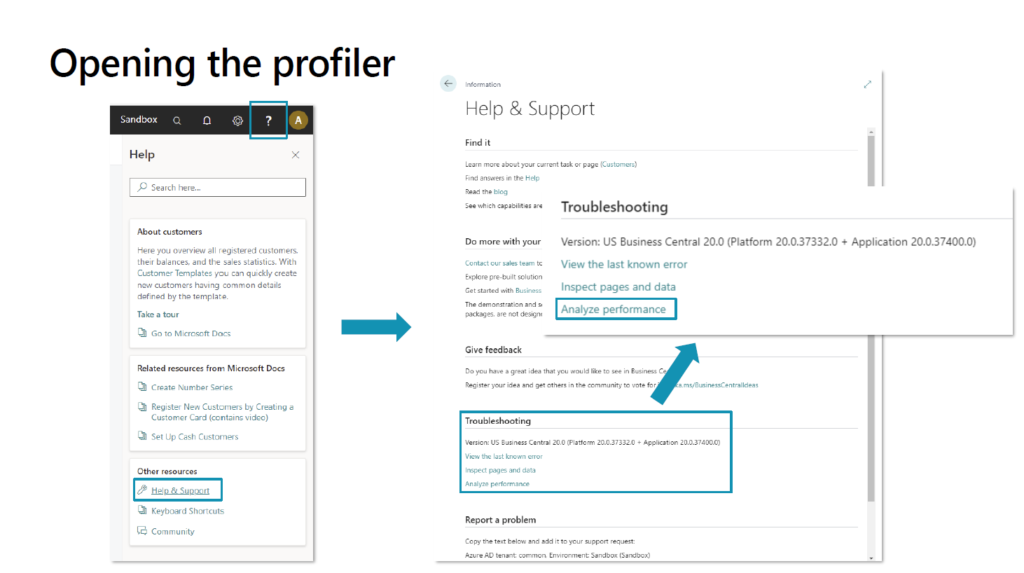
The in-client performance profiler will be a new app page that can be reached on its own or from the Help & Support page.
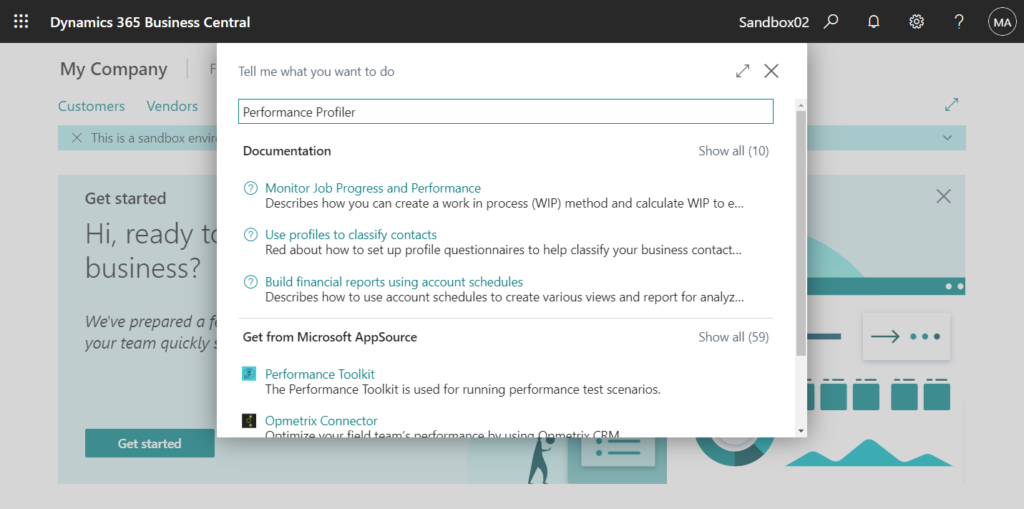
Choose the Tell Me icon, enter Performance Profiler, and then choose the related link.
Or click Analyze performance in Help & Support.
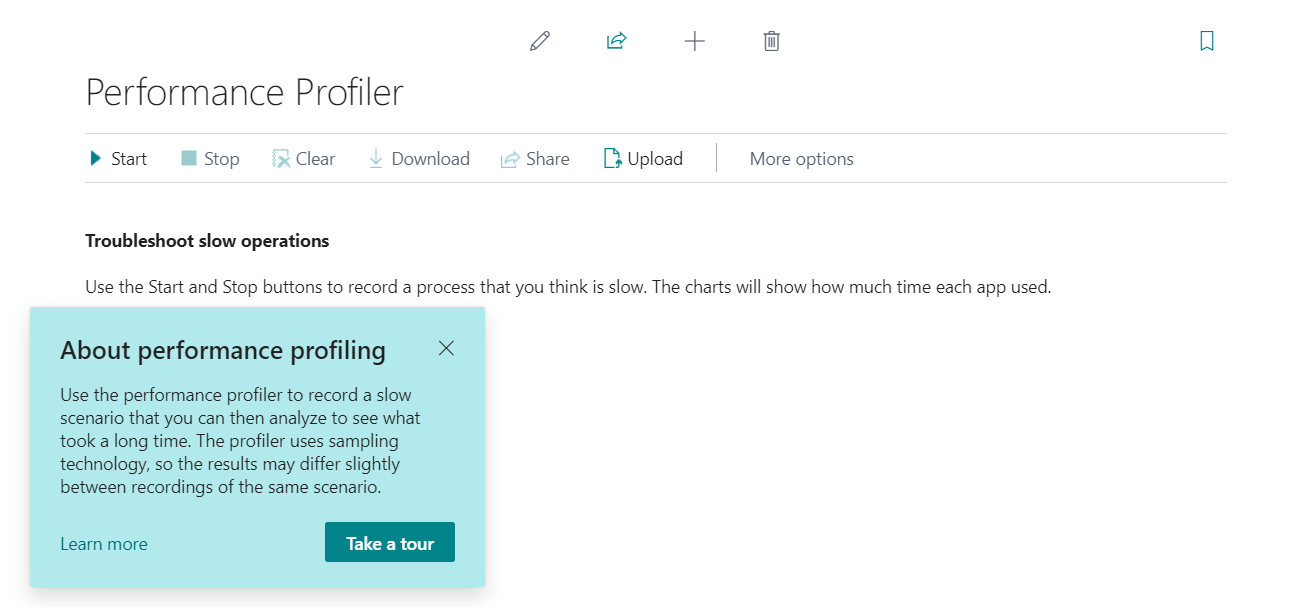
The Performance Profiler page will be opened.
Performance Profiler (24, Card):
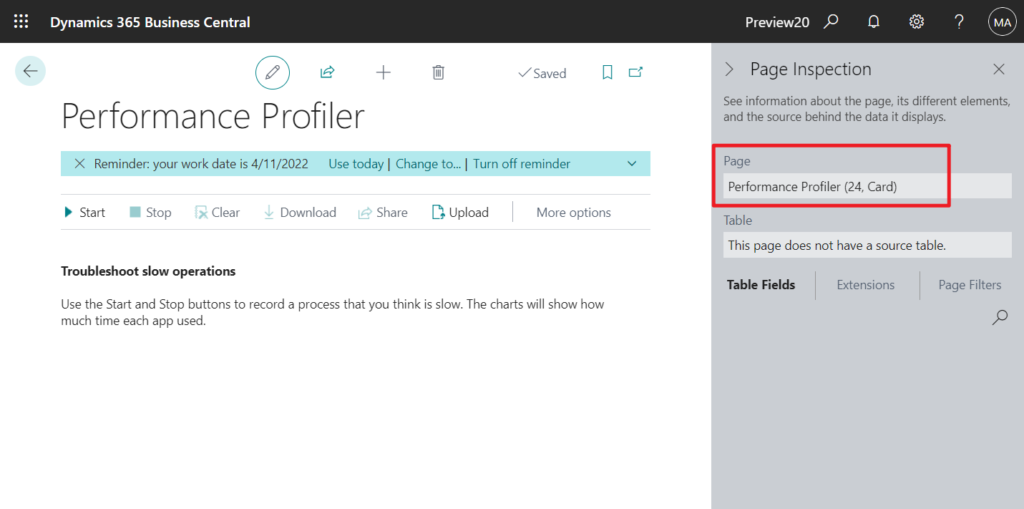
PS: You can not find this page in BC19.5.
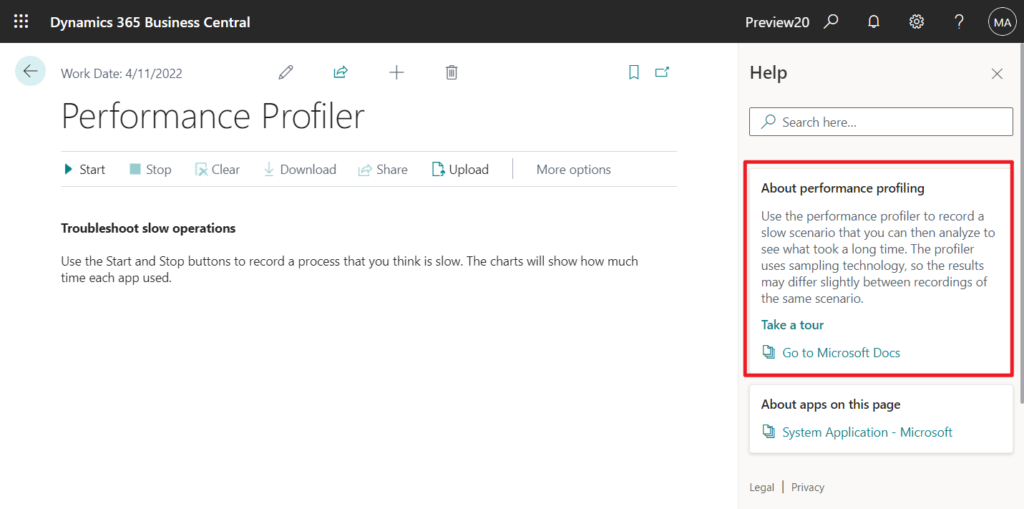
Let’s first look at the description of this new feature in Business Central.
About performance profiling
Use the performance profiler to record a slow scenario that you can then analyze to see what took a long time. The profiler uses sampling technology, so the results may differ slightly between recordings of the same scenario.
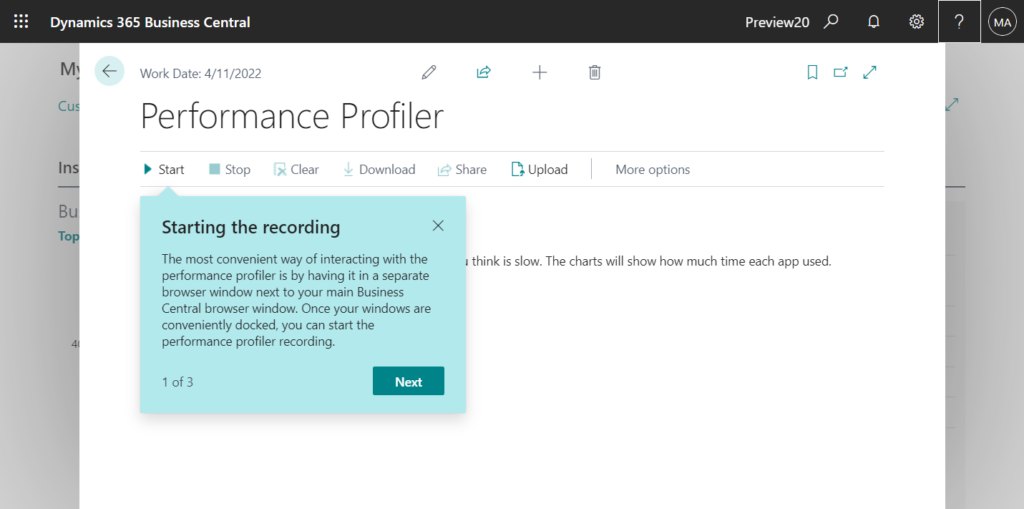
Start:
Starting the recording
The most convenient way of interacting with the performance profiler is by having it in a separate browser window next to your main Business Central browser window. Once your windows are conveniently docked, you can start the performance profiler recording.
Stop:
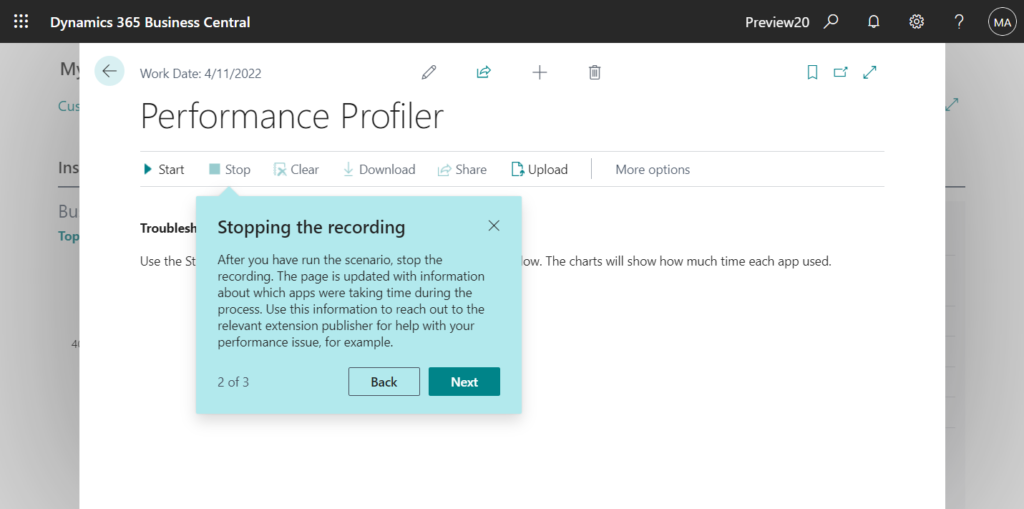
Stopping the recording
After you have run the scenario, stop the recording. The page is updated with information about which apps were taking time during the process. Use this information to reach out to the relevant extension publisher for help with your performance issue, for example.
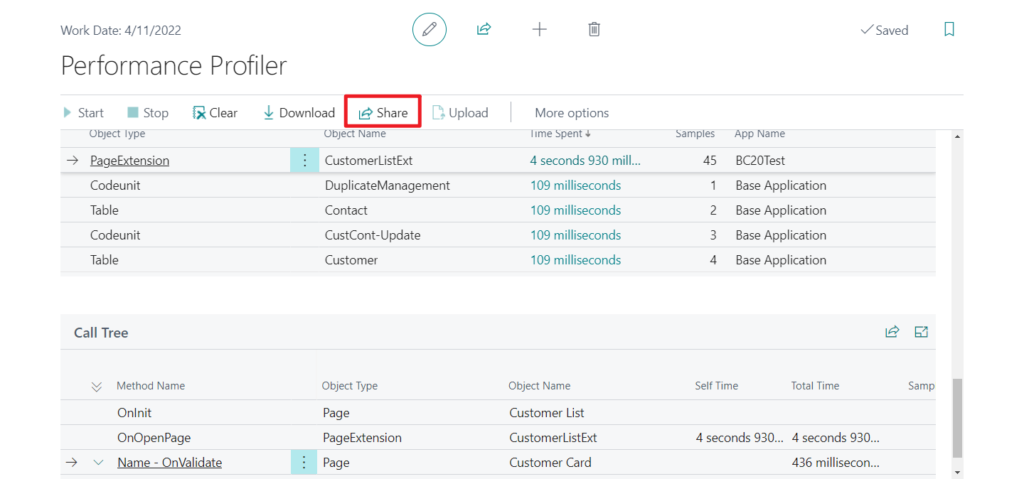
Share:
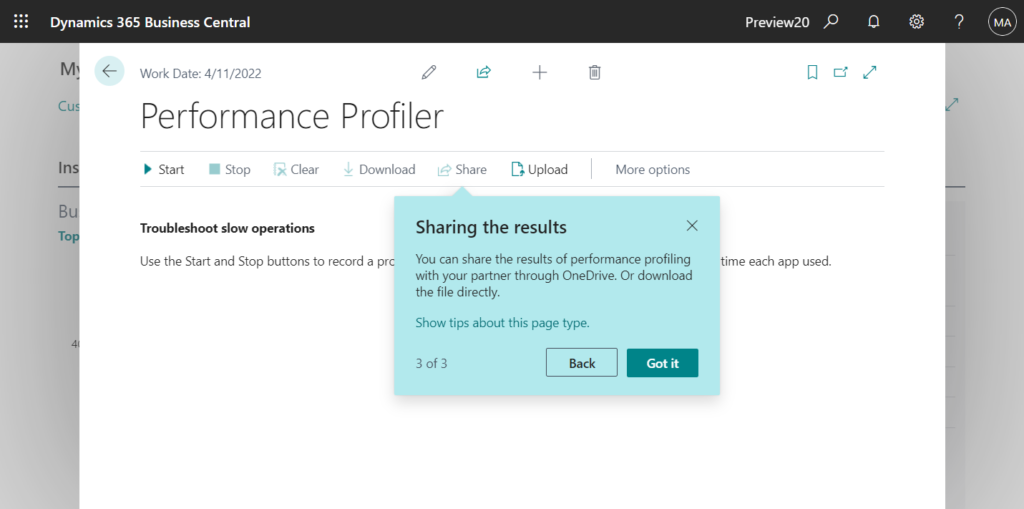
Sharing the results
You can share the results of performance profiling with your partner through OneDrive. Or download the file directly.
Okay, let’s try to test.
For example: I wrote a simple code that affects the performance of Customer List.
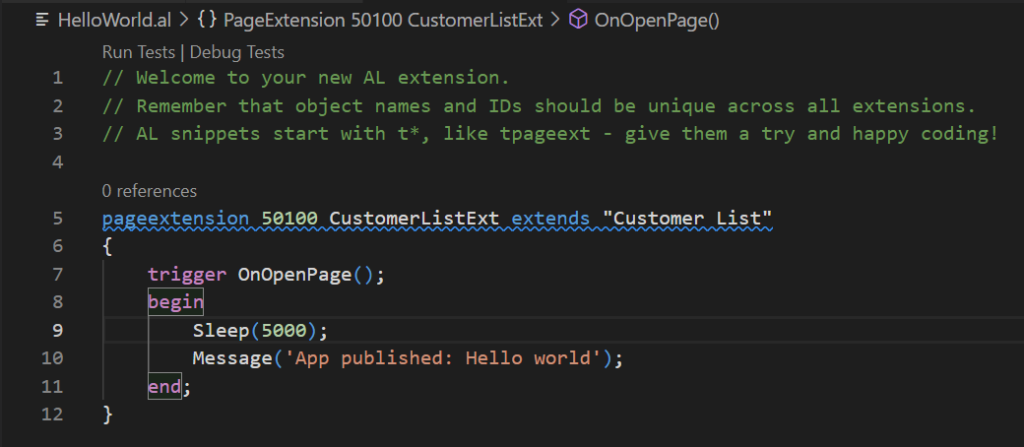
Test content: Open the Customer List page, then select a customer, and eidt the customer name.
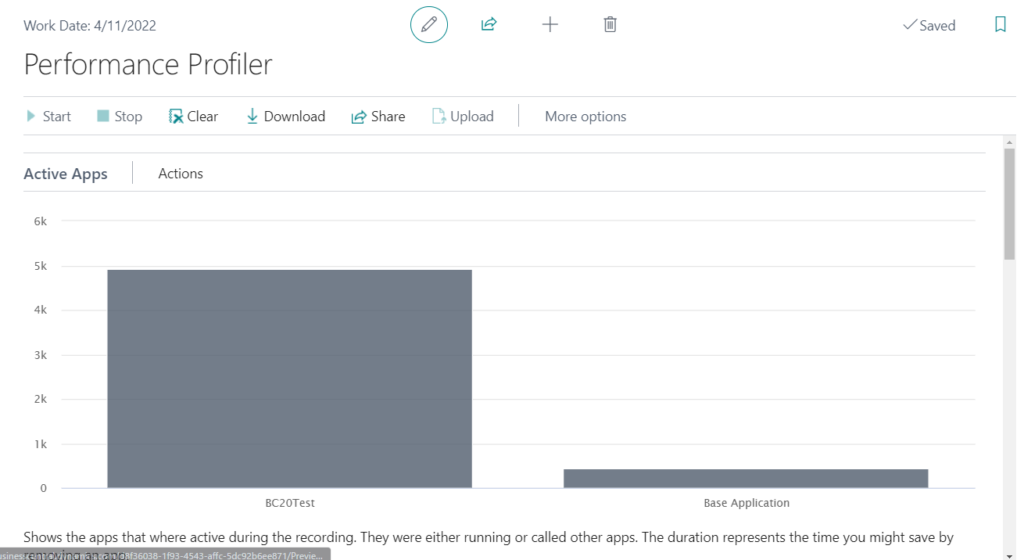
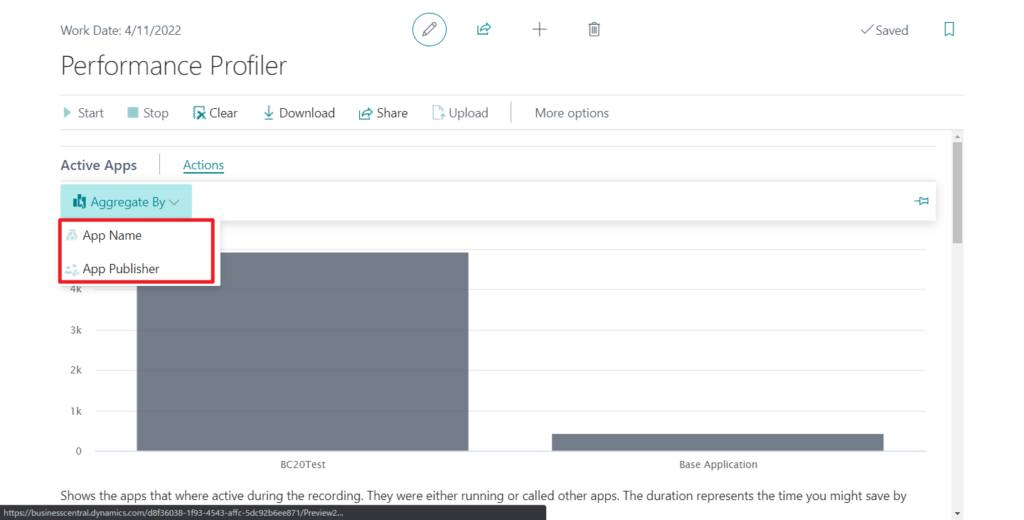
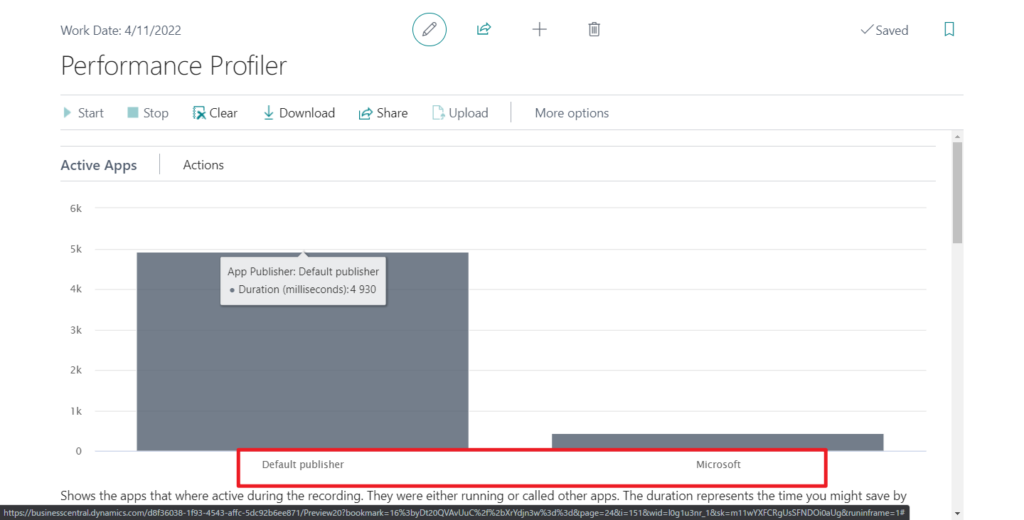
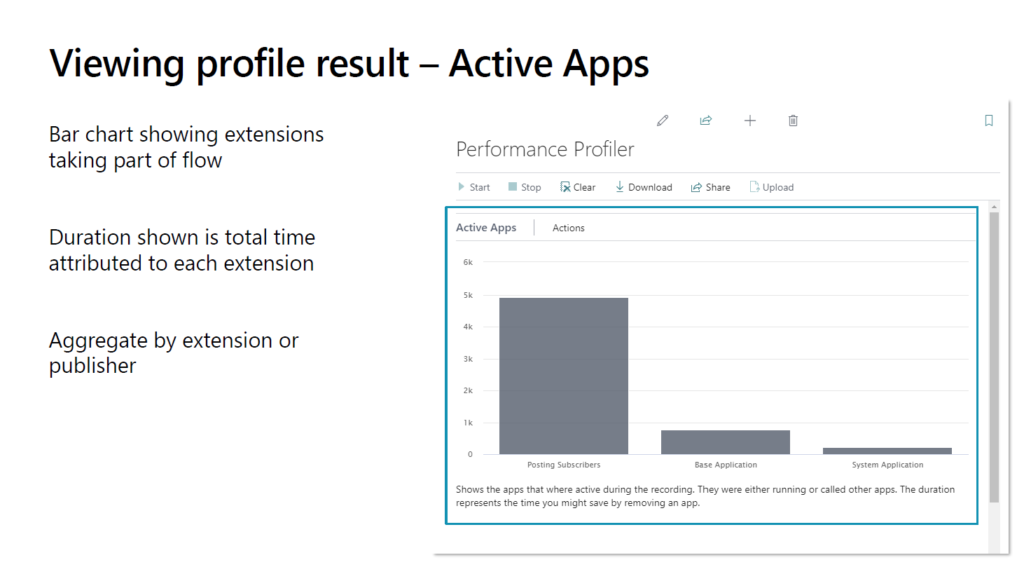
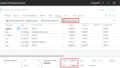
Active Apps: Shows the apps that where active during the recording. They were either running or called other apps. The duration represents the time you might save by removing an app.
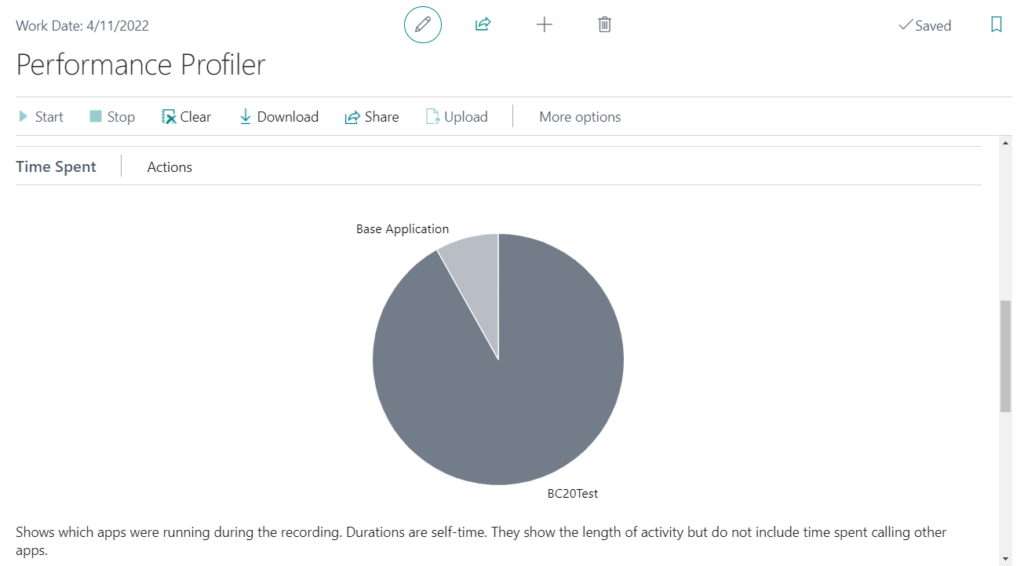
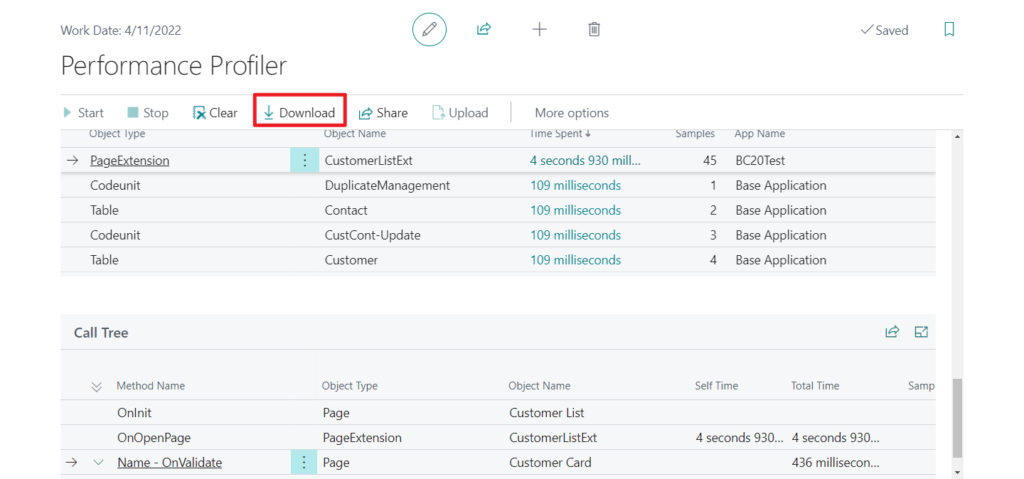
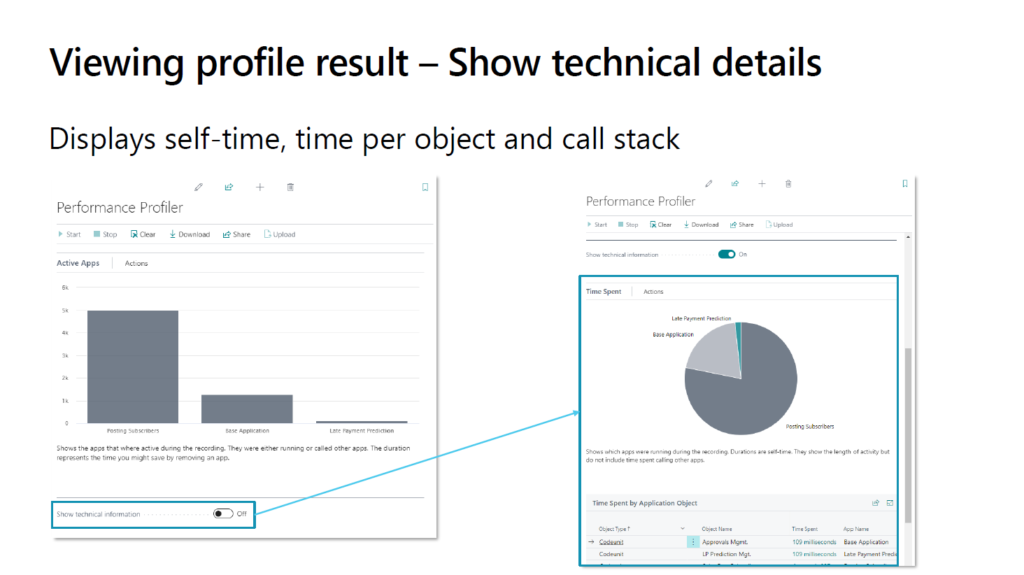
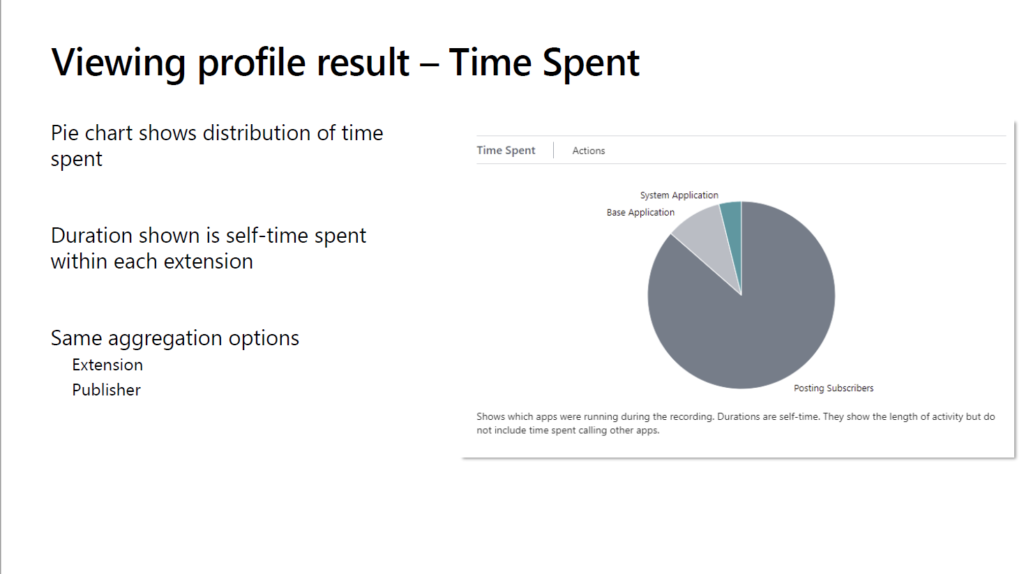
Time Spent: Shows which apps were running during the recording. Durations are self-time. They show the length of activity but do not include time spent calling other apps.
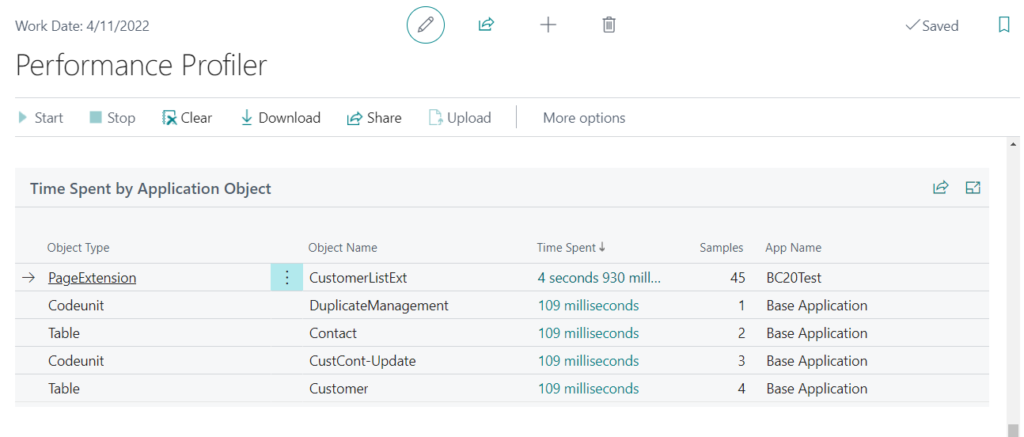
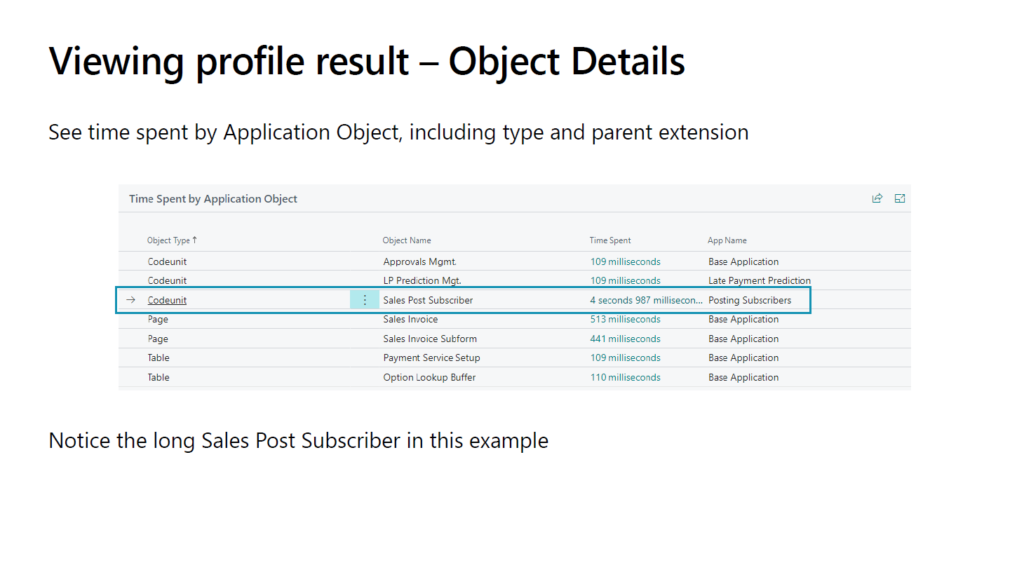
Time Spent by Application Object:
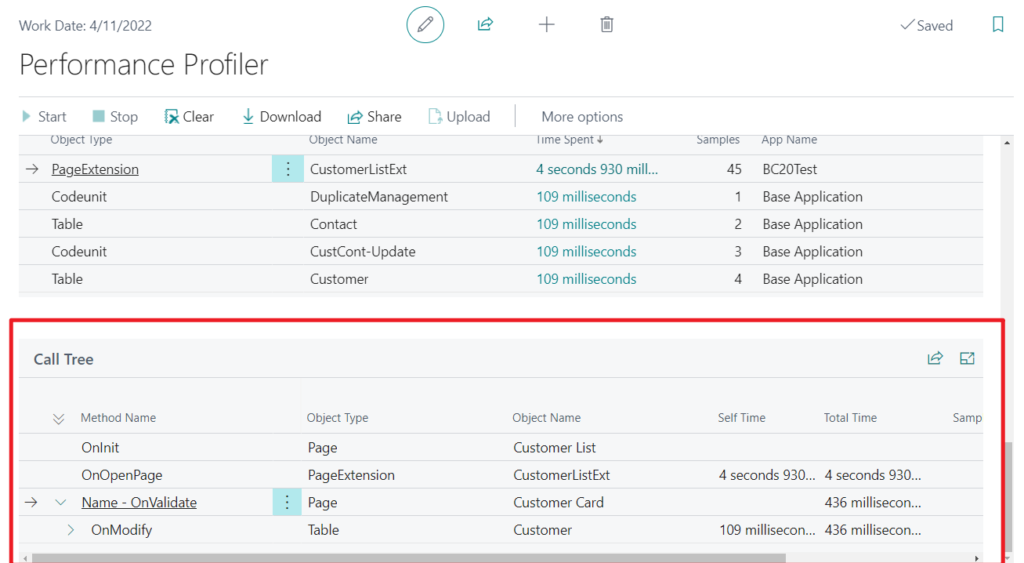
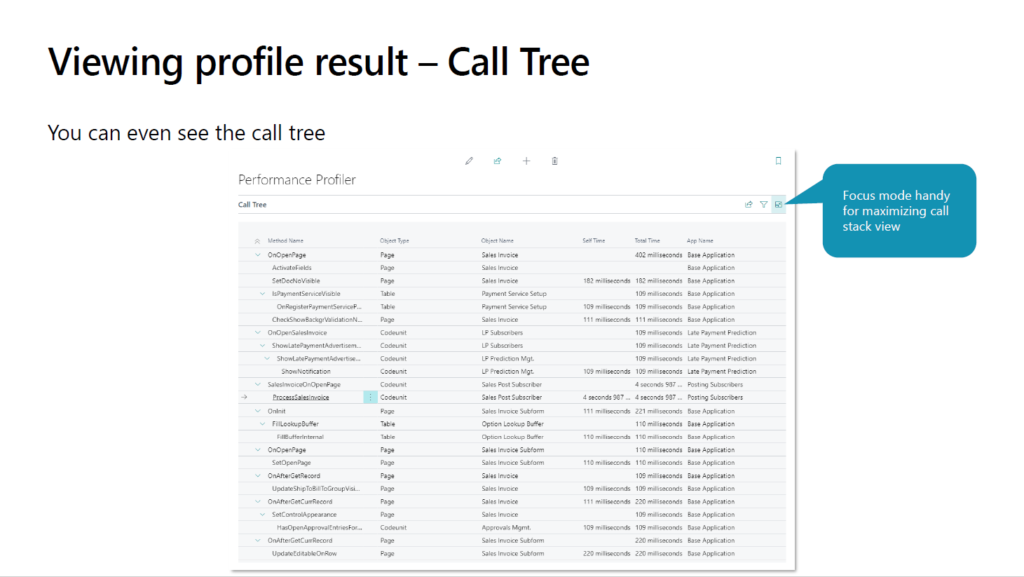
Call Tree:
Test Video:
So excited update, give it a try!!!😁
PS:
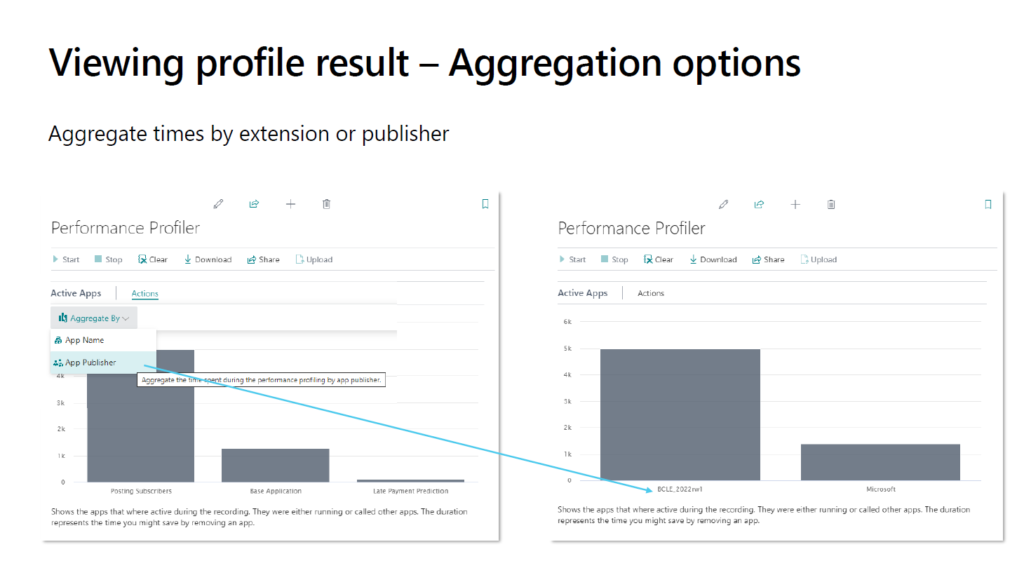
1. You can aggregate by App Name or App Publisher.
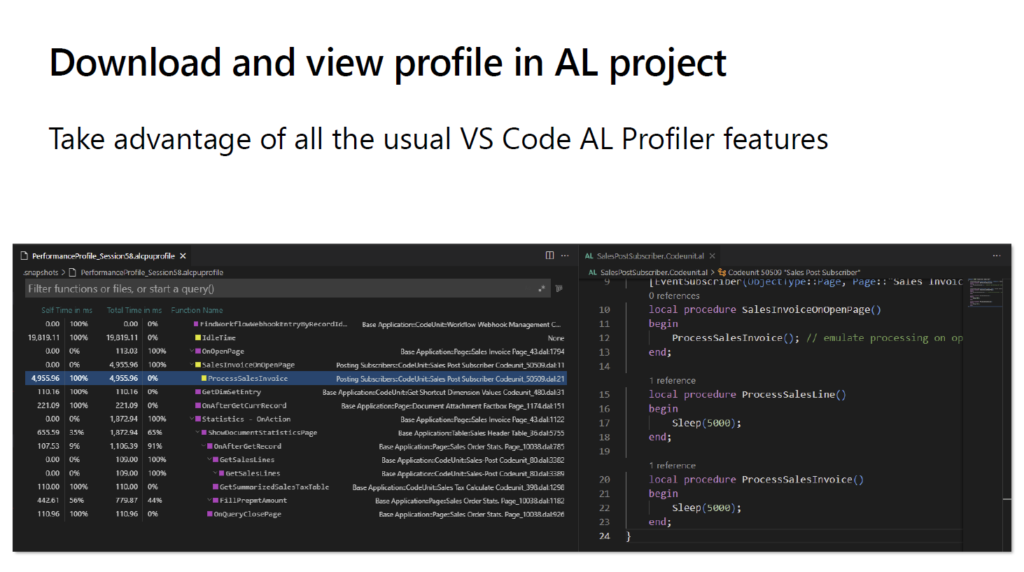
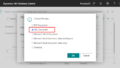
2. You can choose Download to download the profile file from the page.
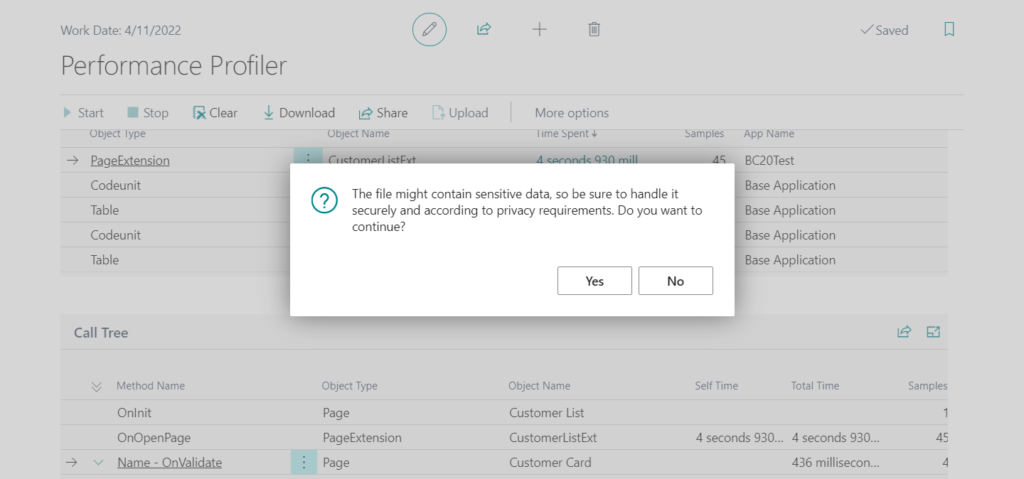
The file might contain sensitive data, so be sure to handle it securely and according to privacy requirements. Do you want to continue?
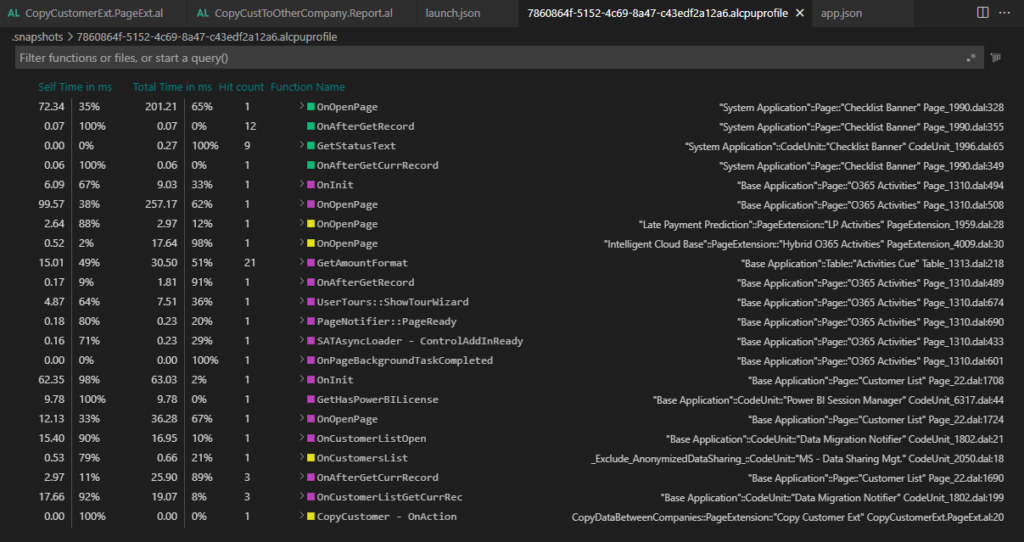
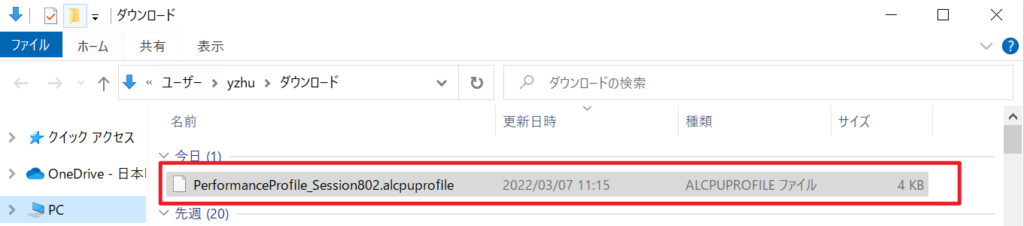
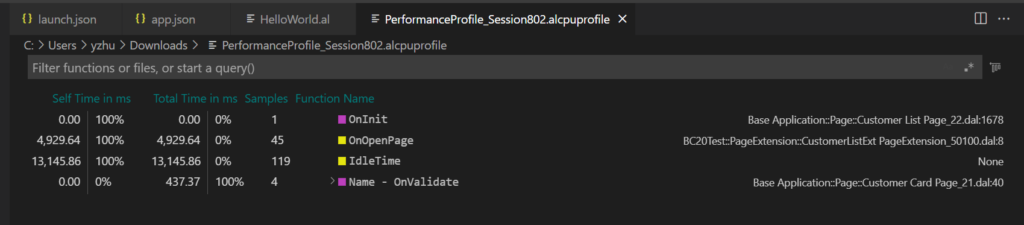
The profile file for AL code has the extension .alcpuprofile and when you open the file, it displays in the performance profiling editor view in Visual Studio Code.
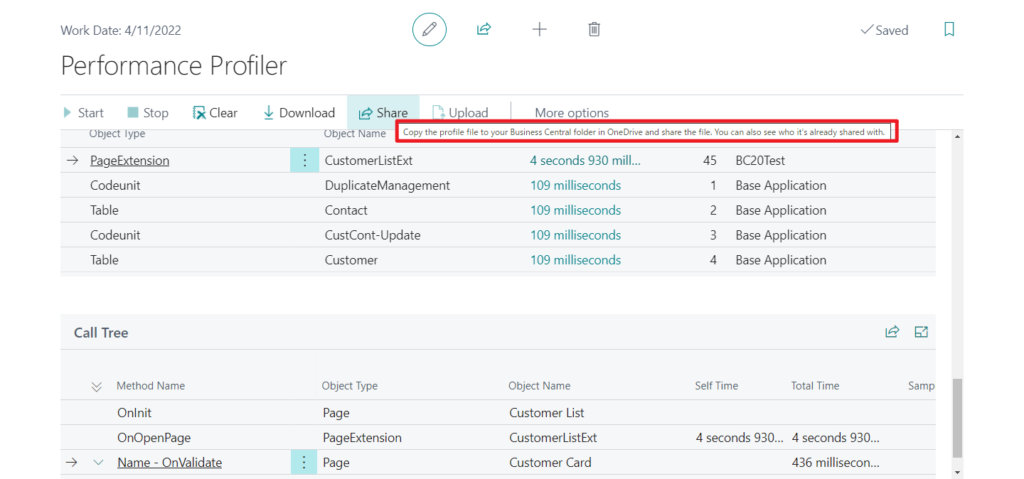
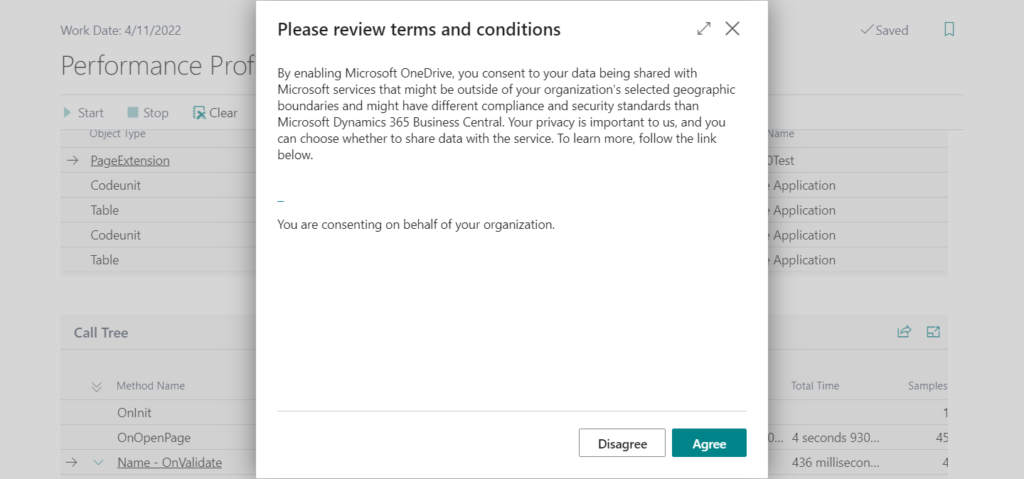
3. You can choose Share to copy the profile file to your Business Central folder in OneDrive.
More details about OneDrive in Business Central:
Cloud Storage and Open in OneDrive
Implement your custom “Open in OneDrive” action
Update info from Dynamics 365 Business Central Launch Event 2022 Release Wave 1:
END
Hope this will help.
Thanks for reading.
ZHU
コメント