Hi, Readers.
The public preview for Dynamics 365 Business Central 2024 release wave 1 (BC24) is available. Learn more: Link.
I will continue to test and share some new features that I hope will be helpful.
Use new Excel layouts for 35 selected reports:
Business value:
https://learn.microsoft.com/en-us/dynamics365/release-plan/2024wave1/smb/dynamics365-business-central/use-new-excel-layouts-35-selected-reports?wt.mc_id=DX-MVP-5004336
Running reports to analyze and present business information is a frequent task in any business. Now you can use the Excel report layouts to interactively generate analyses and present learnings.
In Business Central 2022 wave 1 (BC20), Microsoft brought us a new layout type, no code or low code reporting with Excel layouts. More details: Business Central 2022 wave 1 (BC20) new features: Excel layouts for BC Reports
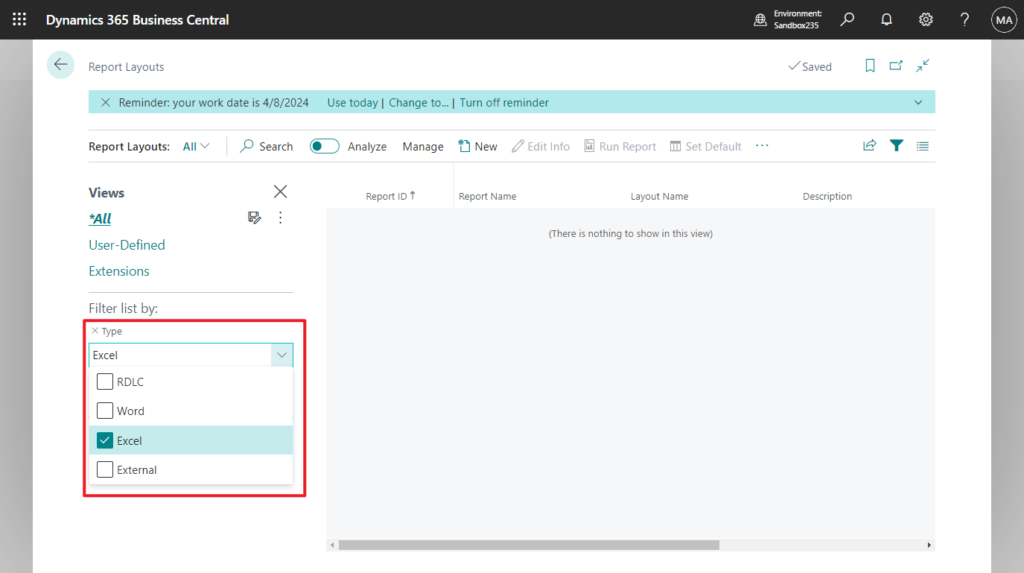
But in the past two years, Microsoft has not had any standard reports using Excel layout.
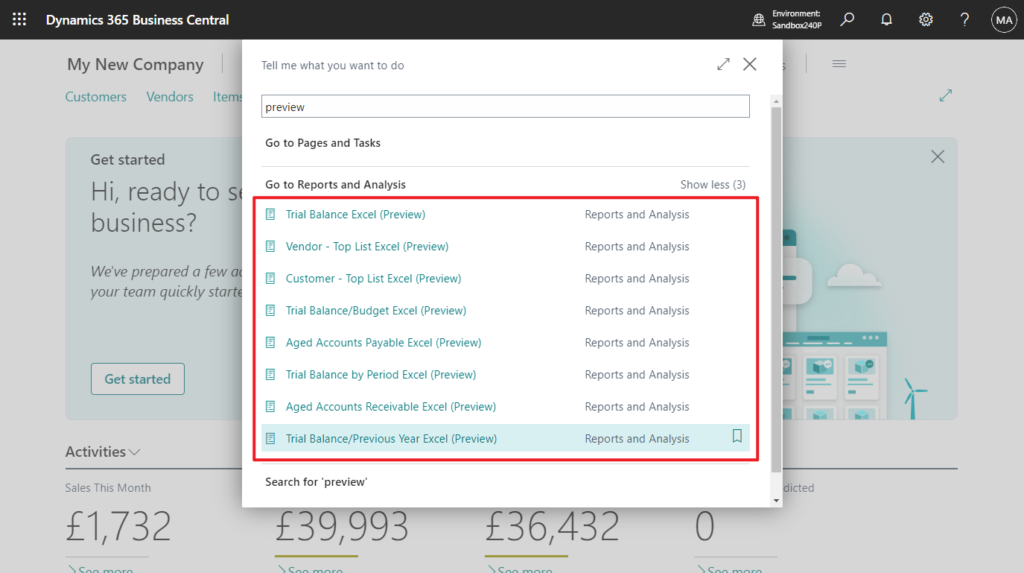
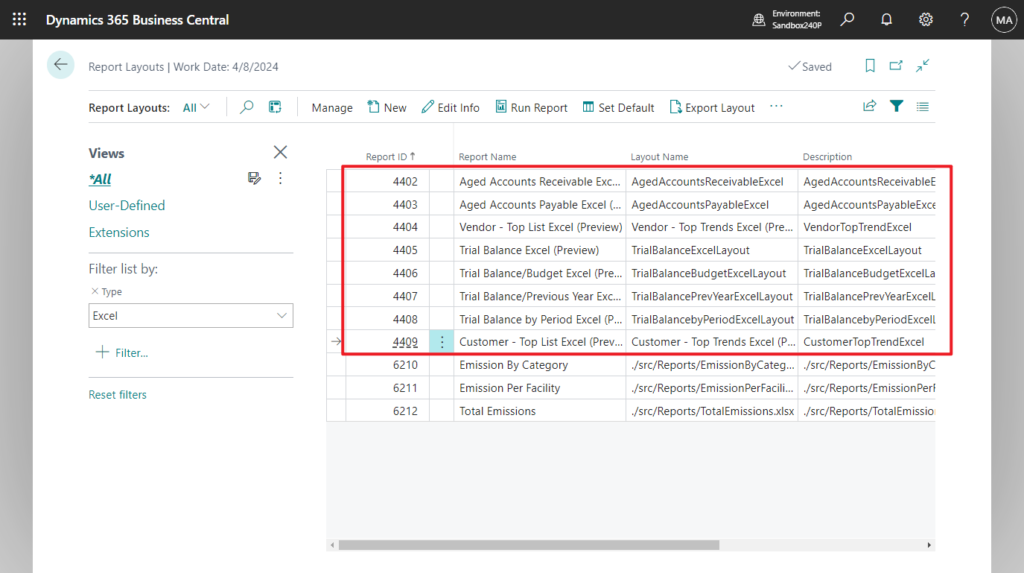
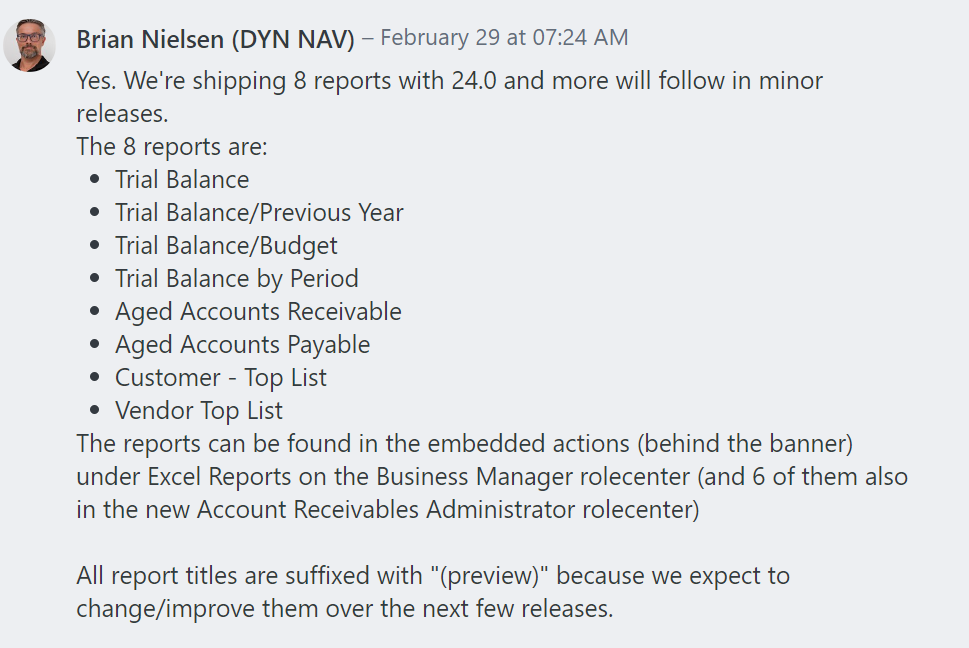
Finally, for this release (BC24) Microsoft has added eight new Excel reports with new report layouts for finance, sales (customers), and purchases (vendors). (All report titles are suffixed with “(preview)”)
Please note that these are completely new reports, not old reports with new excel layout added.
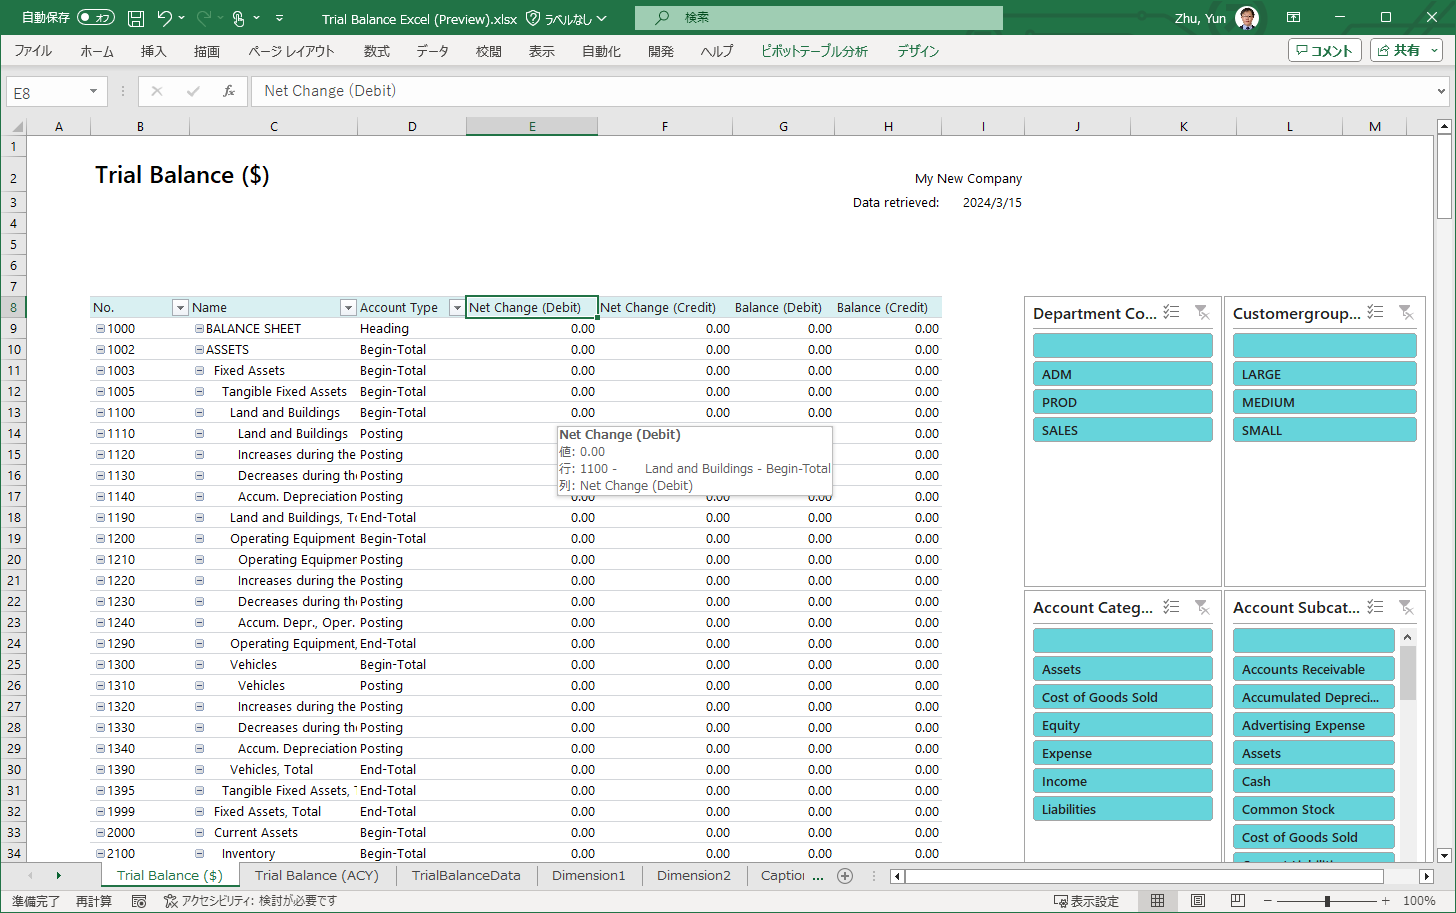
For example, EXR Trial Balance Excel (4405, Report Request)
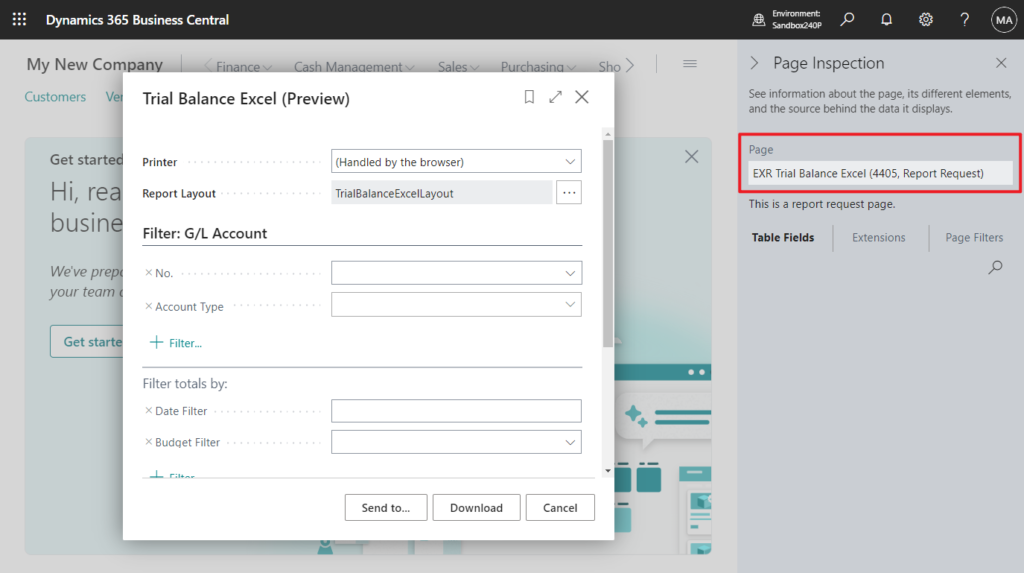
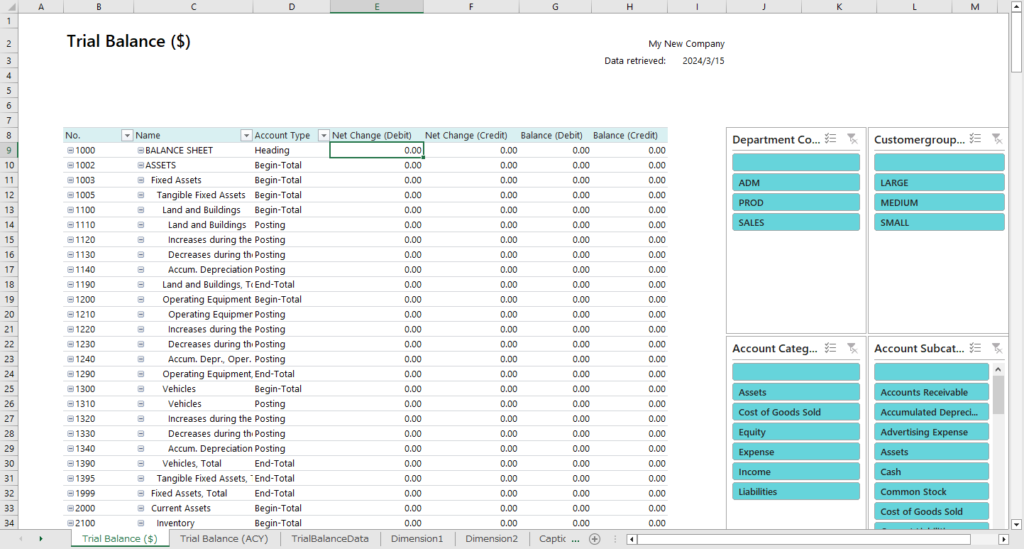
The reports give you more options in creating your own Excel layouts for the report by giving you not only the report, but also data from the report request pages and data for translations of a layout. If the data in the reports comes from multiple tables, the report layouts show the data in multiple worksheets, which makes it easy to understand where the data originated.
The reports are flexible, and you can use them in the way that best fits your needs:
- Use the reports as-is to get insight about your business.
- Use pivot tables to slice and dice data for analysis.
- Use them as a template to create your own Excel layouts for the same data.
You can create your own copies of the report layouts from the Report Layouts page. To learn more about how to create Excel report layouts, go to Creating an Excel layout report.
https://learn.microsoft.com/en-us/dynamics365/release-plan/2024wave1/smb/dynamics365-business-central/use-new-excel-layouts-35-selected-reports?wt.mc_id=DX-MVP-5004336
And Microsoft expect to add more layouts to cover more functional areas. More details in Viva Engage (formerly Yammer): Link
Note
The Excel reports are limited to around 1 million rows. For reports that have a high volume of data, we recommend that you use the report request page to filter your data.
Great. Give it a try!!!😁
PS: A request page has a predefined set of buttons depending on the report type and the current layout. The standard buttons are:
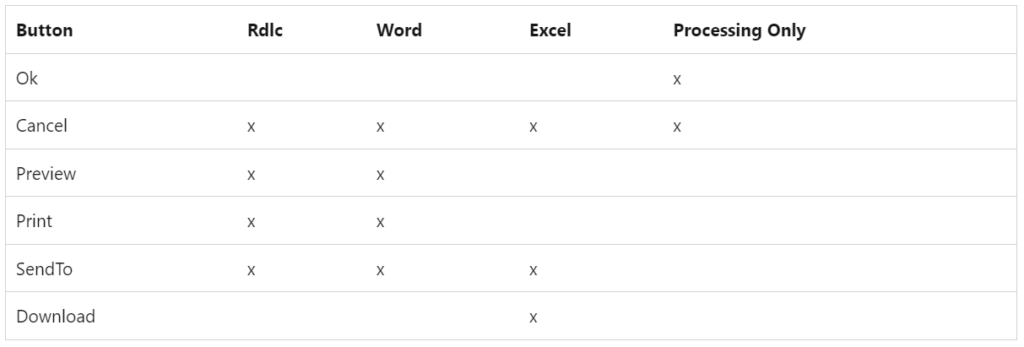
More details: Using request pages with reports
END
Hope this will help.
Thanks for reading.
ZHU



コメント