Hi, Readers.
The public preview for Dynamics 365 Business Central 2023 release wave 2 (BC23) is available. Learn more: Link.
I will continue to test and share some new features that I hope will be helpful.
Open Visual Studio Code from web client to investigate or troubleshoot extensions:
Business value:
Recreating a locally installed Visual Studio Code workspace to investigate or troubleshoot a customer environment includes manually creating workspaces, projects, and launch configurations, and downloading symbols, all of which require knowledge as well as time to go through it.To simplify and speed up this process, a new option to open a local Visual Studio Code instance for the current extension and environment will be added to the web client, allowing just a single click to set up a matching VS Code project for investigation or troubleshooting.
https://learn.microsoft.com/en-us/dynamics365/release-plan/2023wave2/smb/dynamics365-business-central/open-visual-studio-code-web-client-investigate-or-troubleshoot-extensions
Debugging is the process of finding and correcting errors. With Visual Studio Code and the AL Language extension for Microsoft Dynamics 365 Business Central, you get an integrated debugger to help you inspect your code and verify that your application can run as expected. You can start a debugging session by pressing F5. For more information about Debugging in Visual Studio Code, see Debugging.
In this wave, as a developer or consultant, you can open a new Visual Studio Code session from within the web client for a specific customer production or sandbox environment.
Two different contexts will be supported:
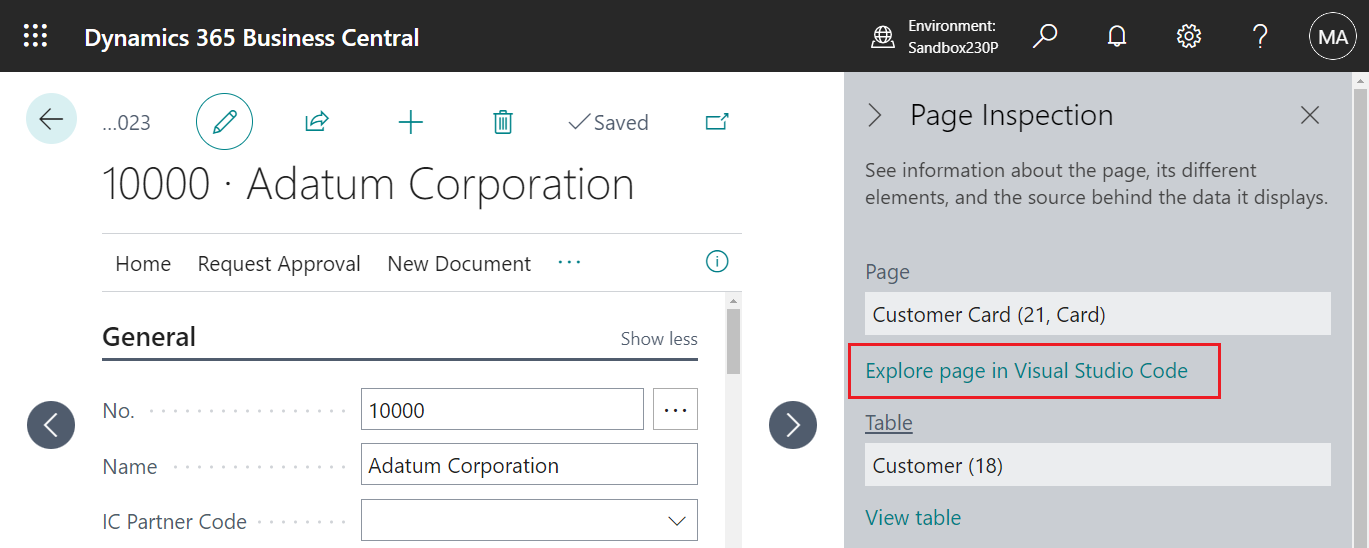
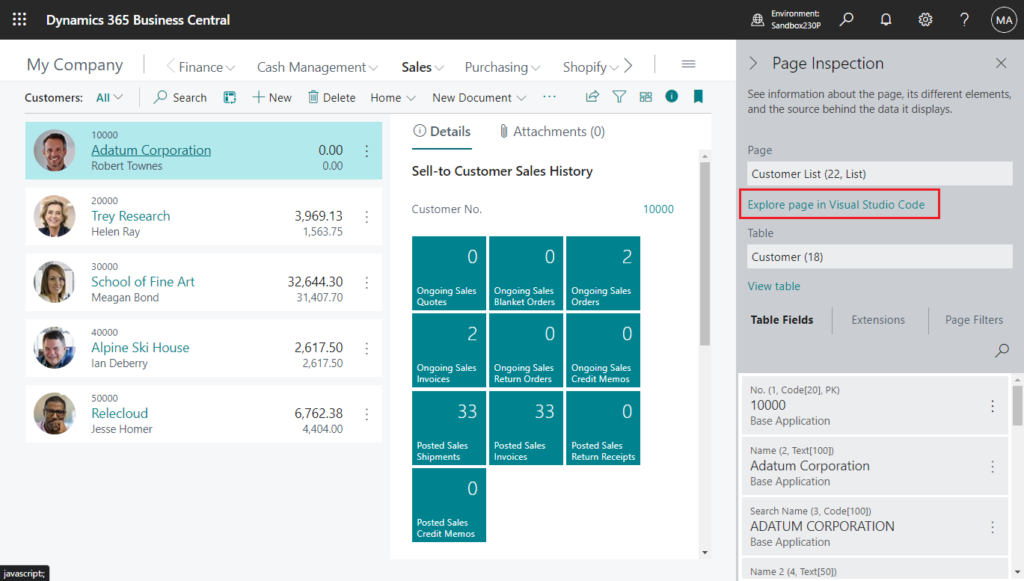
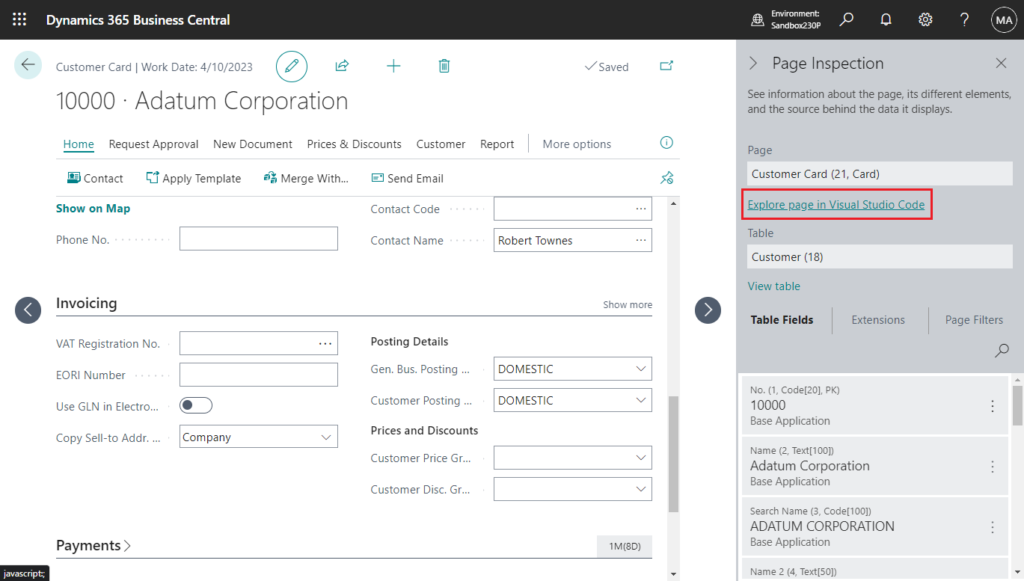
1. Open a page from within the Page Inspector.
Choose Explore page in Visual Studio Code:
Specifies the URL that opens this page in Visual Studio Code and attaches debugger to current session.
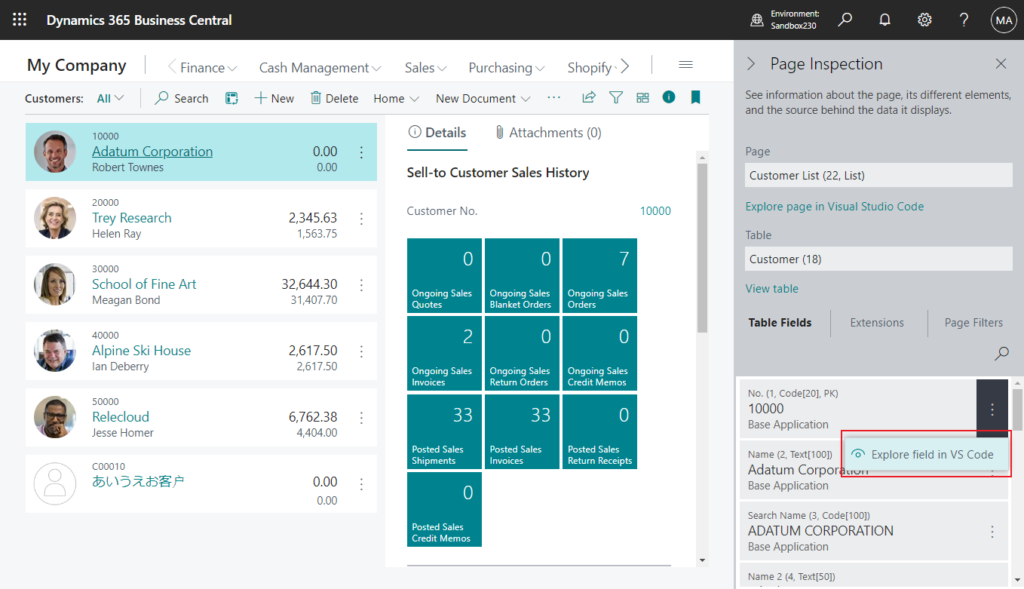
Or you can also choose Explore field in VS Code.
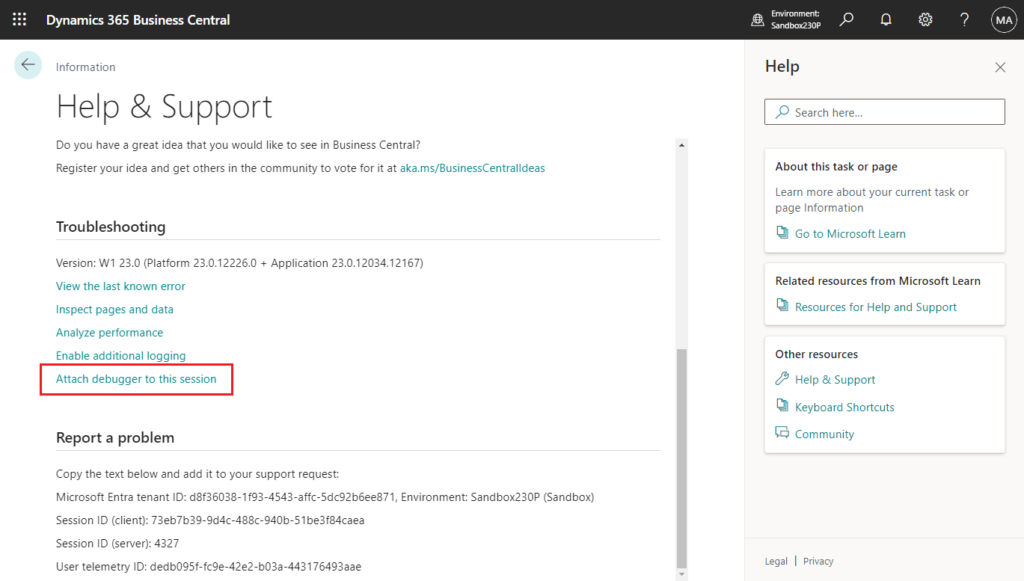
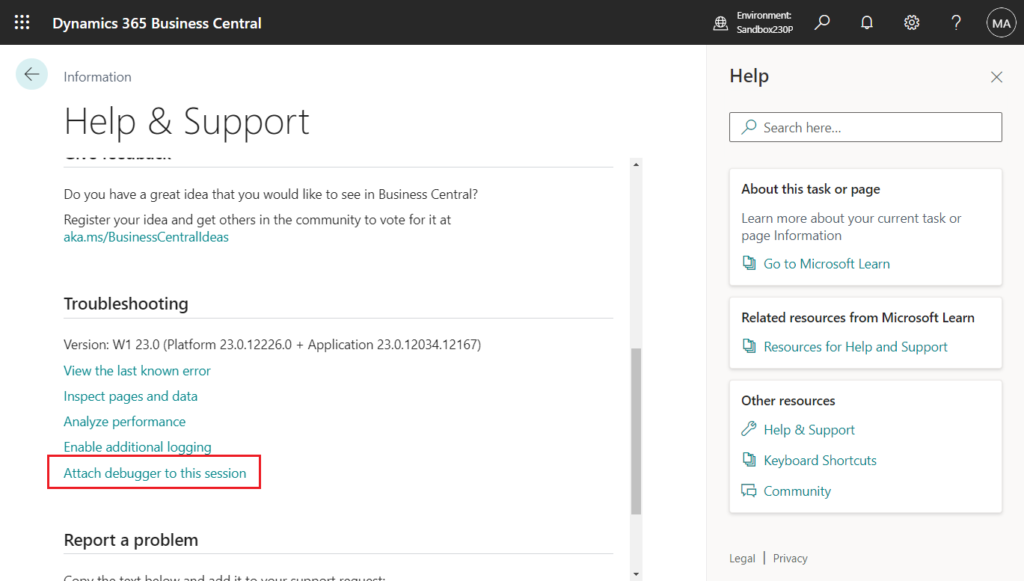
2. Troubleshoot the current session from within the Help and Support page.
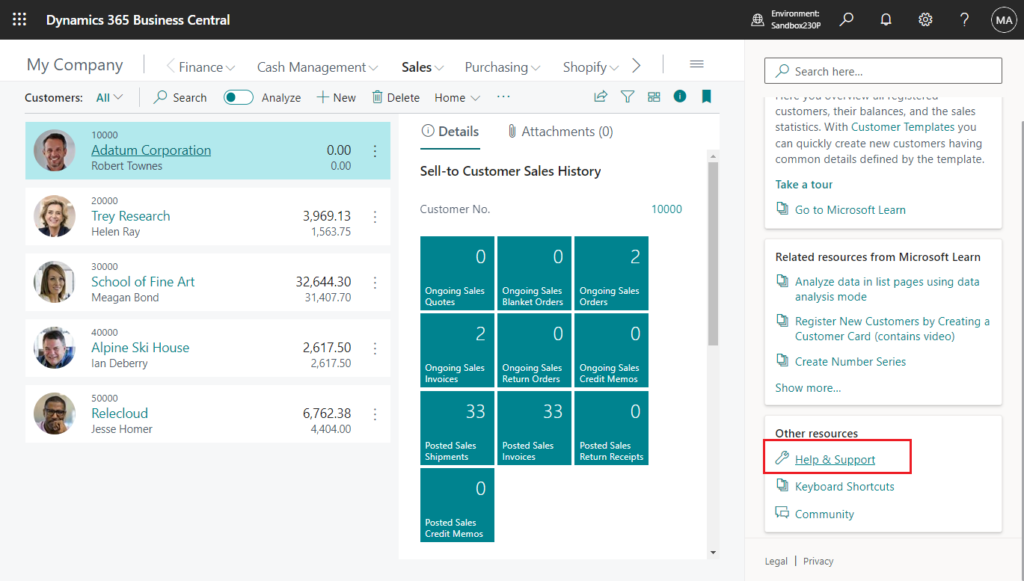
Choose Attach debugger to this session:
Depending on the context, Visual Studio Code will open to allow inspecting objects and source, and optionally attach to debug the current web client session:
- If Visual Studio Code is already open, the last active session will be used; otherwise, a new Visual Studio Code will open. If the AL Language extension isn’t installed, the user will be asked to install it, and the process ends.
- The user will be asked if they want to investigate, or debug sandbox or production.
- A new project will be created, and a matching launch configuration will be created, depending on production or sandbox environment.
- If the user chooses to investigate, symbols for the invoked page will be added and the AL Explorer will open to easily allow browsing objects.
- If the user chooses to debug, Visual Studio Code will attach to the web client process, which it was invoked from and await breaking on error.
- In both cases, access to the source code will be gated by the resource exposure profile settings for each extension.
Let’s see more details.
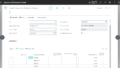
Choose Explore page in Visual Studio Code on the Customer Card page.
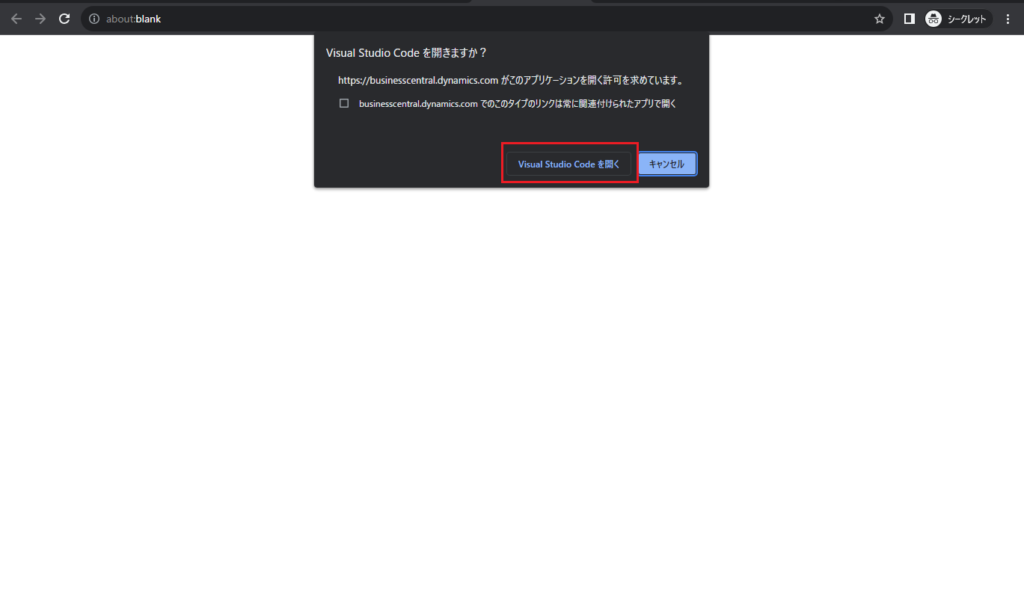
Choose Open Visual Studio Code.
PS: If the AL Language extension isn’t installed, the user will be asked to install it.
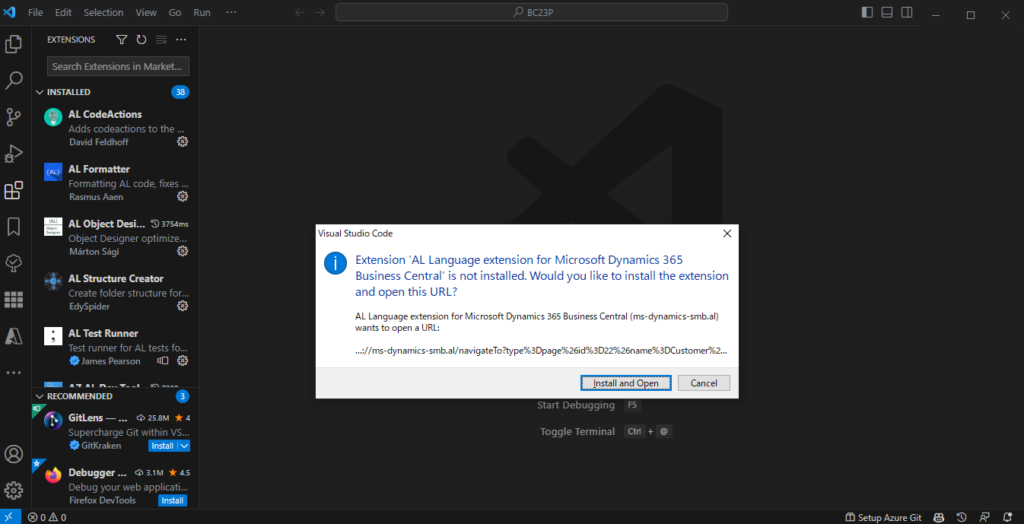
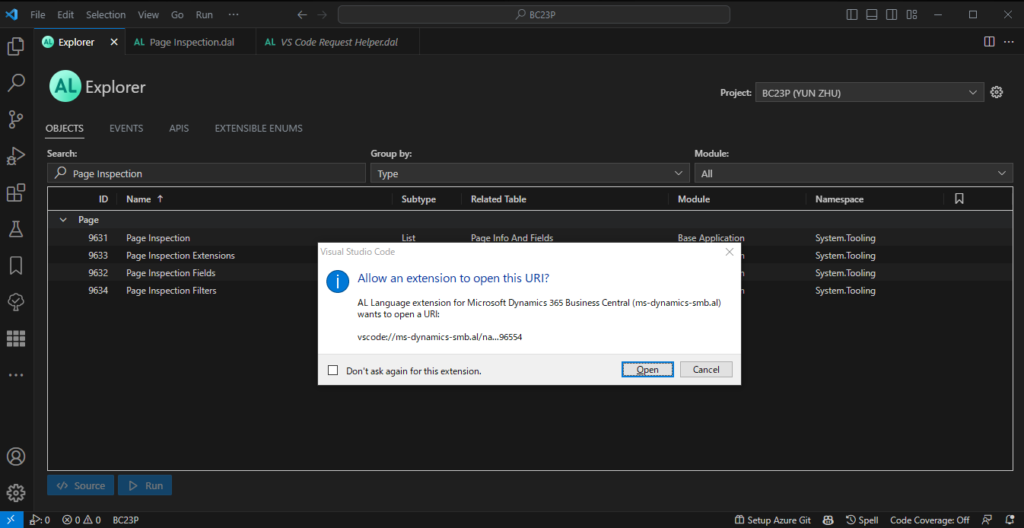
If the AL Language extension is installed, the following message will be displayed. Choose Open.
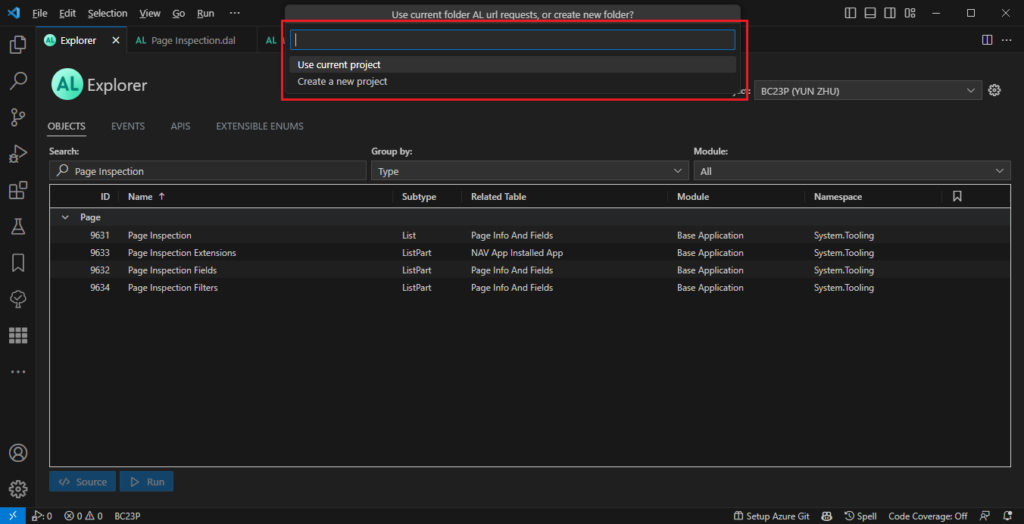
Then you can choose Use current project or Create a new project.
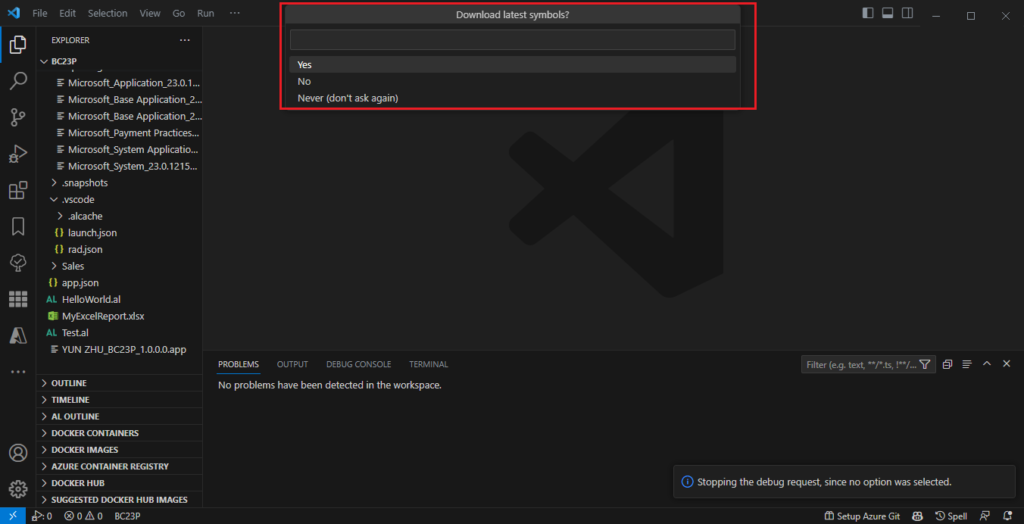
Download latest symbols? Choose Yes or No.
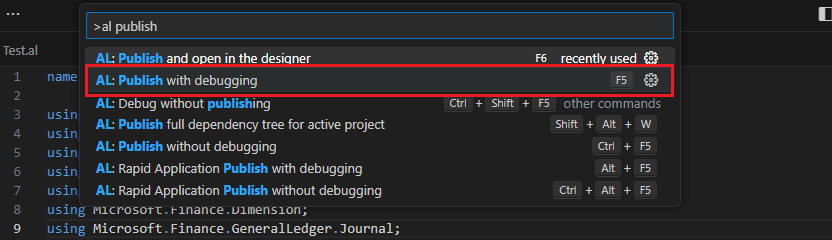
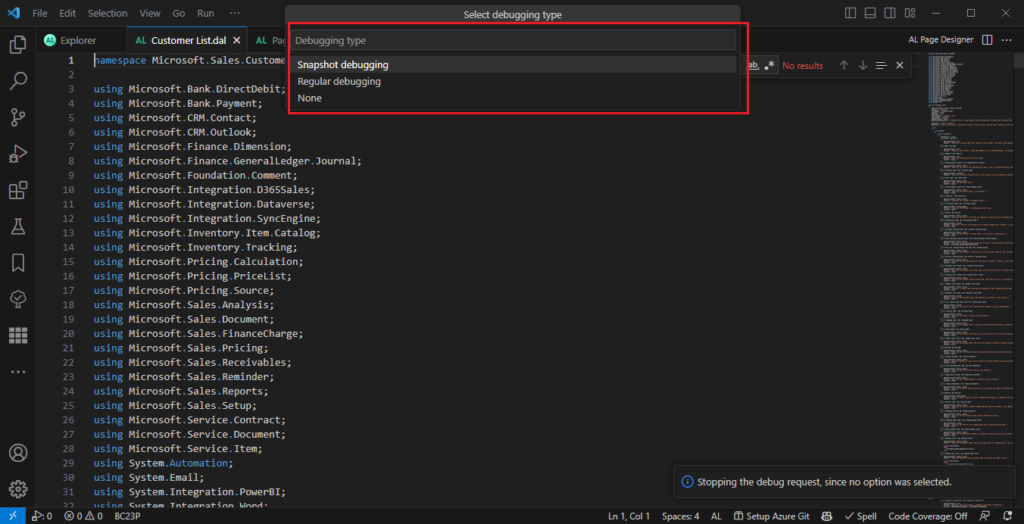
Debugging type: Choose Snapshot debugging, Regular debugging or None.
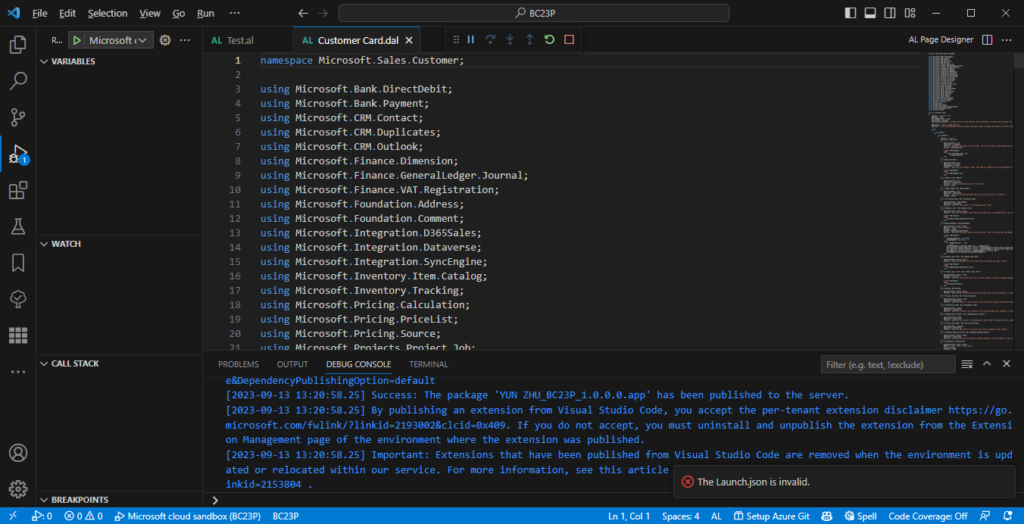
Finally the Debug session will be started in VS Code.
Test video (Use current project):
Test video (Create a new project): The automatically generated app name is GeneratedProject1
This makes it easier for developers and consultants to debug the system. As shown above, including installing AL Language, setting the launch.json connection file, and downloading the symbol file, these are all completed automatically. Give it a try!!!😁
PS:
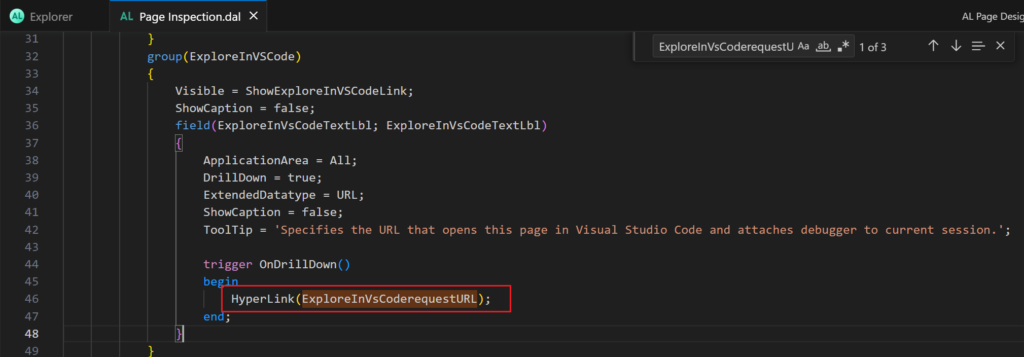
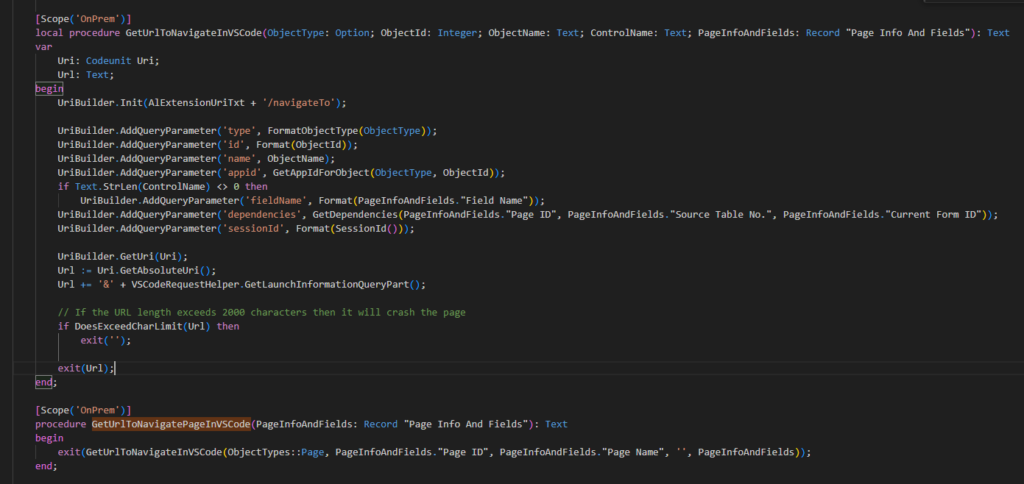
1. If you’re interested in the internal processing, you can trace this processing in the following order
page 9631 “Page Inspection”:
Codeunit “VS Code Request Helper”:
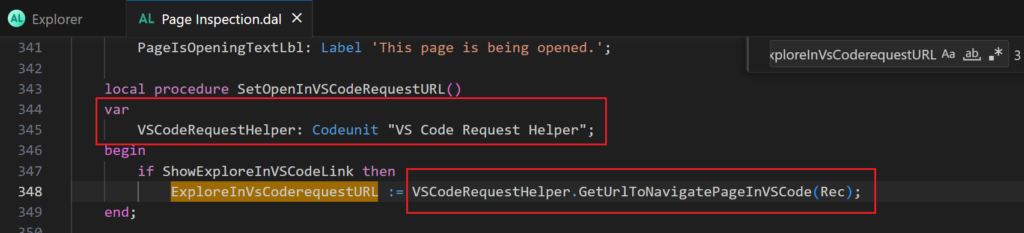
Access = Internal;
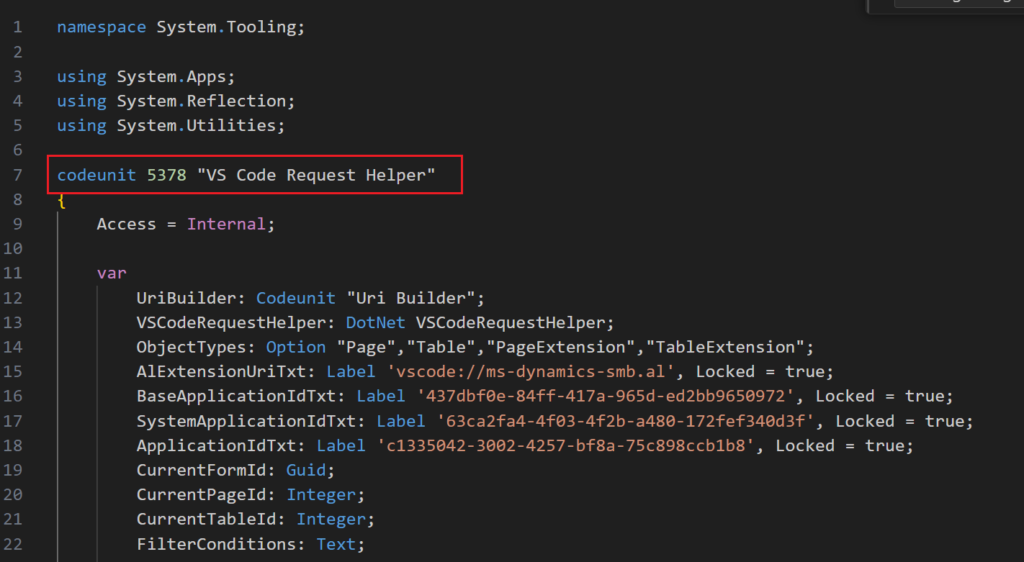
[Scope(‘OnPrem’)]
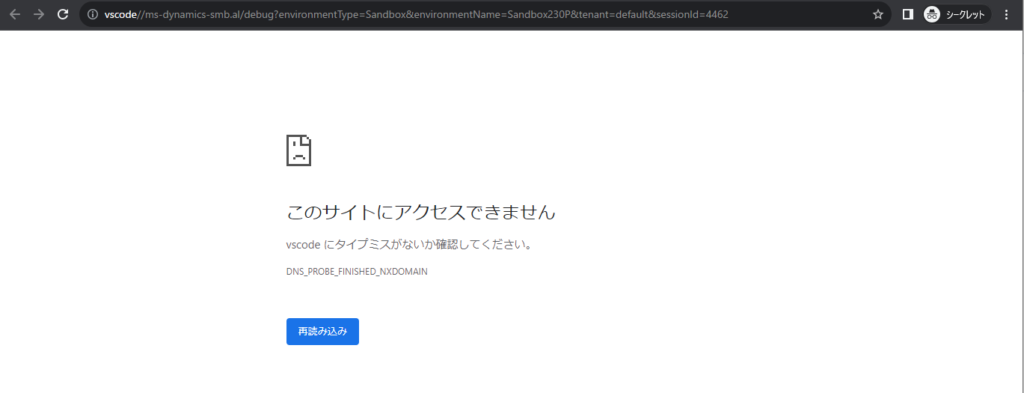
2. As of now (2022.09.13), Attach debugger to this session in Help and Support page is not available.
More details about Troubleshoot in Visual Studio Code directly from the web client
Good to know:
- If Visual Studio Code is already open, the last active session is used; otherwise, a new Visual Studio Code session opens. If the AL Language extension isn’t installed, the user is asked to install it, and the process ends.
- When invoked, a new project is created, and a matching launch configuration is created, depending on the current environment being a production or sandbox environment.
- If the user chooses to debug, Visual Studio Code attaches to the web client process, which it was invoked from and awaits breaking on error.
- If reusing a project and the source files aren’t up to date with the version on the server, the breakpoints will not be hit correctly when debugging. For more information, see Snapshot debugging.
- When you choose to generate new projects, remember to delete the projects occasionally to not accumulate many unused projects.
- Running the web client in a browser, you’re typically not running the browser as an administrator, which means that Visual Studio Code also doesn’t open in administrator mode. So, for example, if Visual Studio Code prompts you for an update, and you choose yes, you’ll get an error, because you don’t have permissions to update. It’s then recommended to shut down Visual Studio Code, and reopen it as an administrator and update it. Then, you can continue debugging.
END
Hope this will help.
Thanks for reading.
ZHU
コメント