
Hi, Readers.
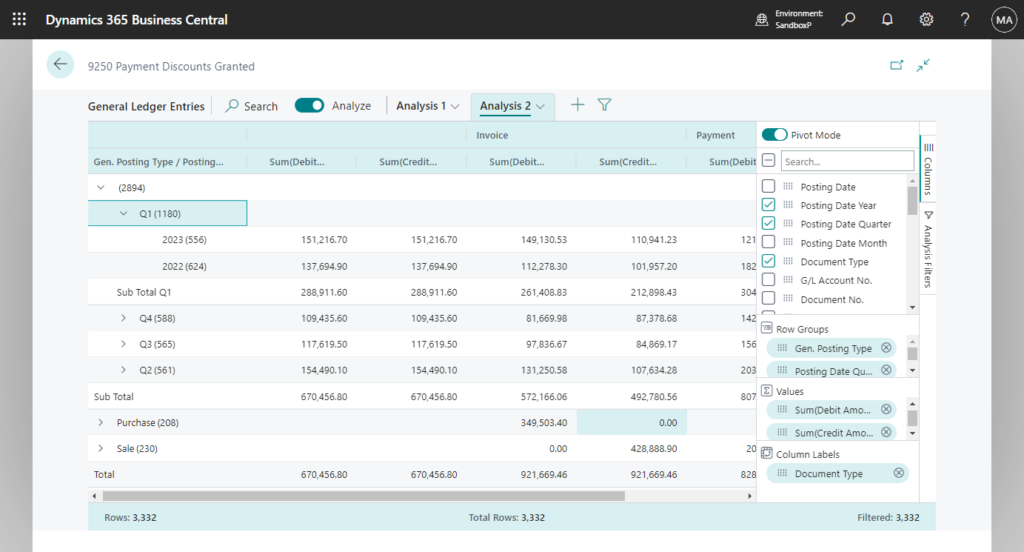
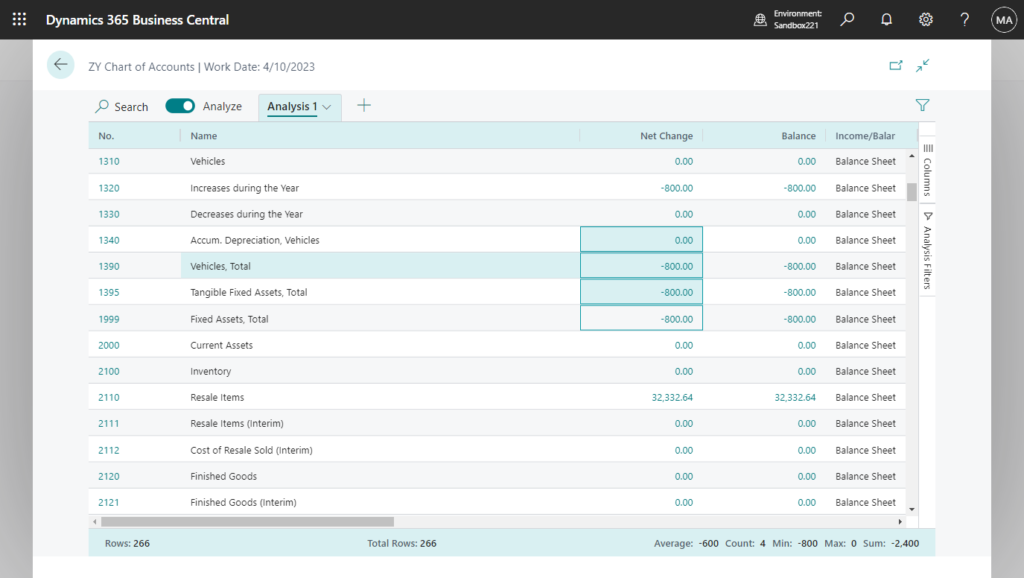
The data analysis mode enables you to analyze data directly from the page, without having to run a report or switch another application like Excel. It provides an interactive and versatile way to calculate, summarize, and examine data. Instead of running reports using different options and filters, you can add multiple tabs that represent different tasks or views on the data. More details: Business Central 2023 wave 1 (BC22) new features: Analyze, group, and pivot data on list pages using multiple tabs (In-client Analysis mode)
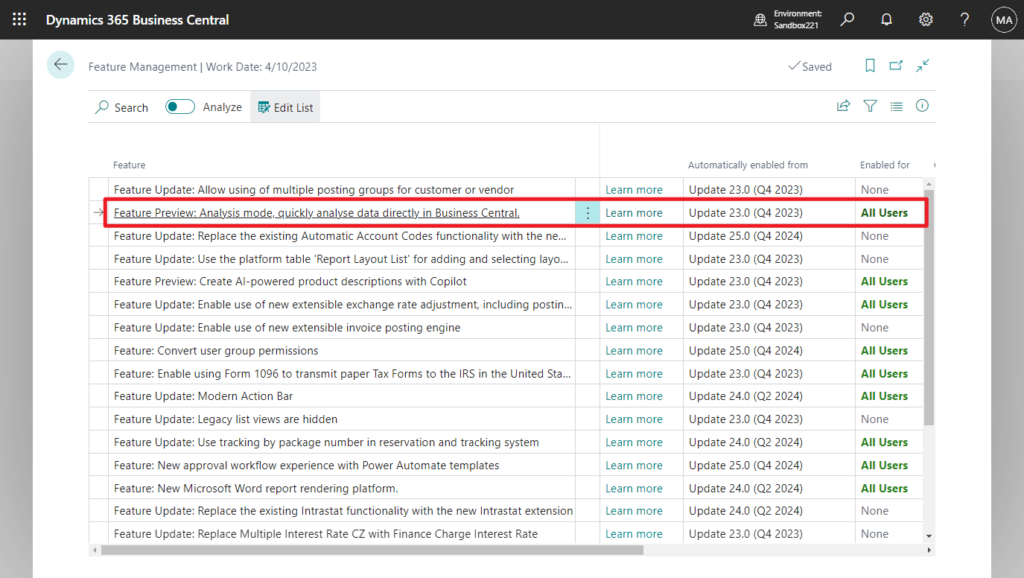
The data analysis mode is currently in preview (2023.05.30), which means that an administrator must turn it on before you can use it. If you’re an administrator, and you want to turn on the data analysis mode, go to the Feature Management page and enable Feature Preview: Analysis mode, quickly analyse data directly in Business Central. For more information about turning features on and off, go to Feature Management.
This is a new feature in Business Central 2023 wave 1 (BC22), we can analyze data from list pages directly in the client without the need to open the page in Excel or run a report.👏😁
And this feature will also work for any custom list pages, you can’t even disable it.
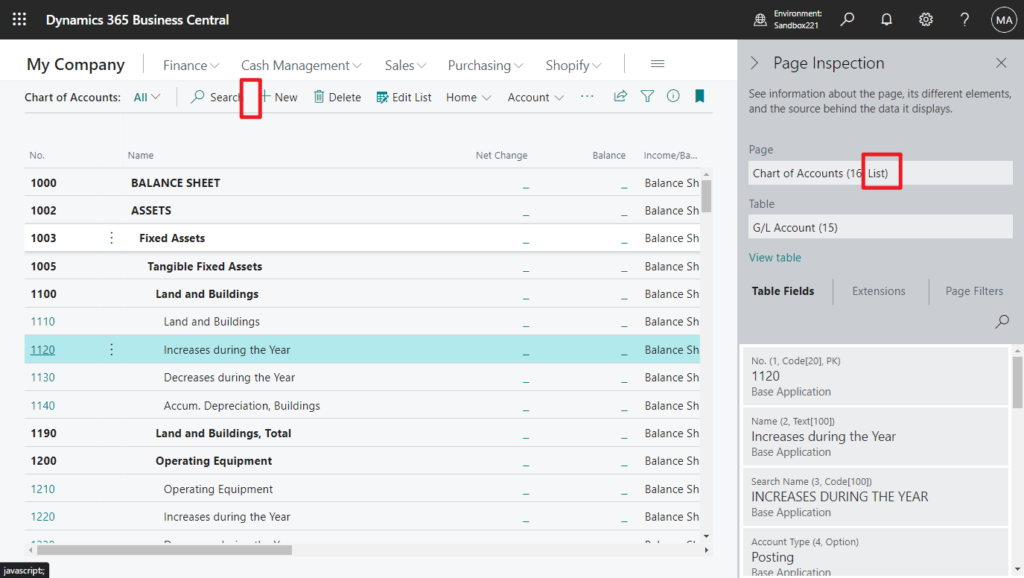
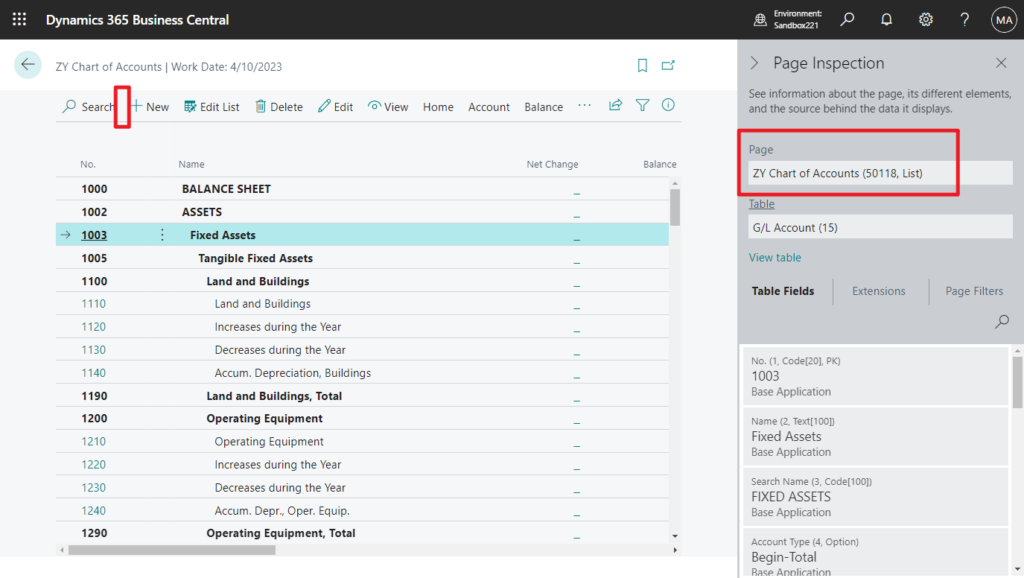
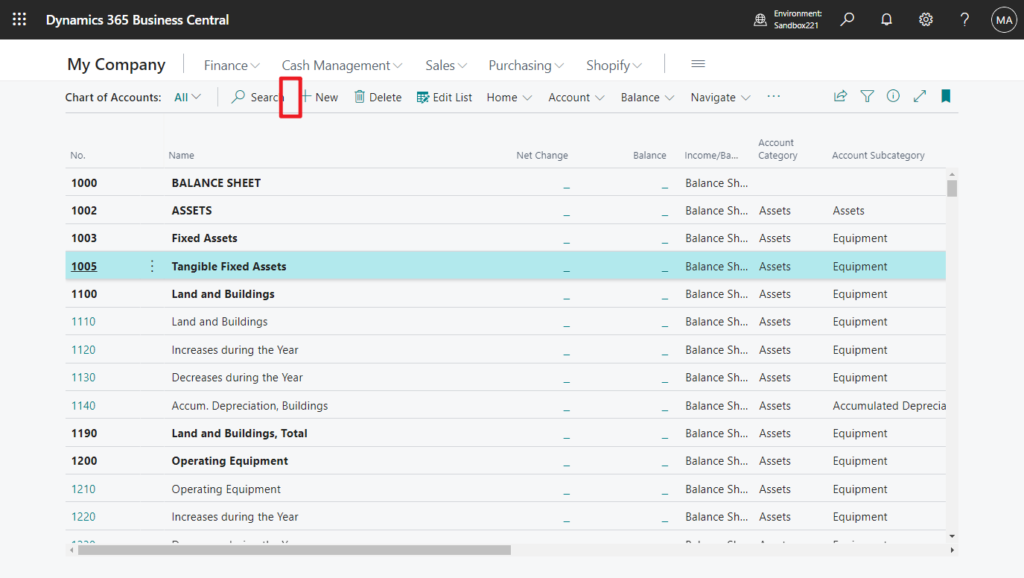
But last week, I was asked a question, why this feature cannot be used in Chart of Accounts (16, List) page.
I thought it was impossible at first until I tested it, yes it didn’t work.
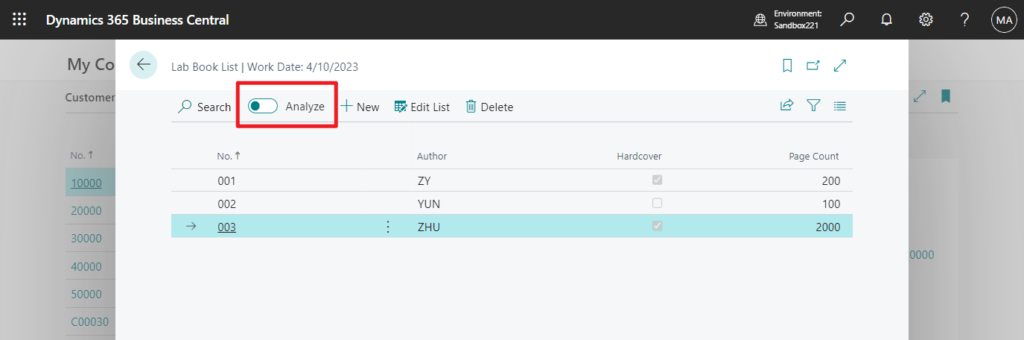
Other list pages, such as Customer List (22, List):
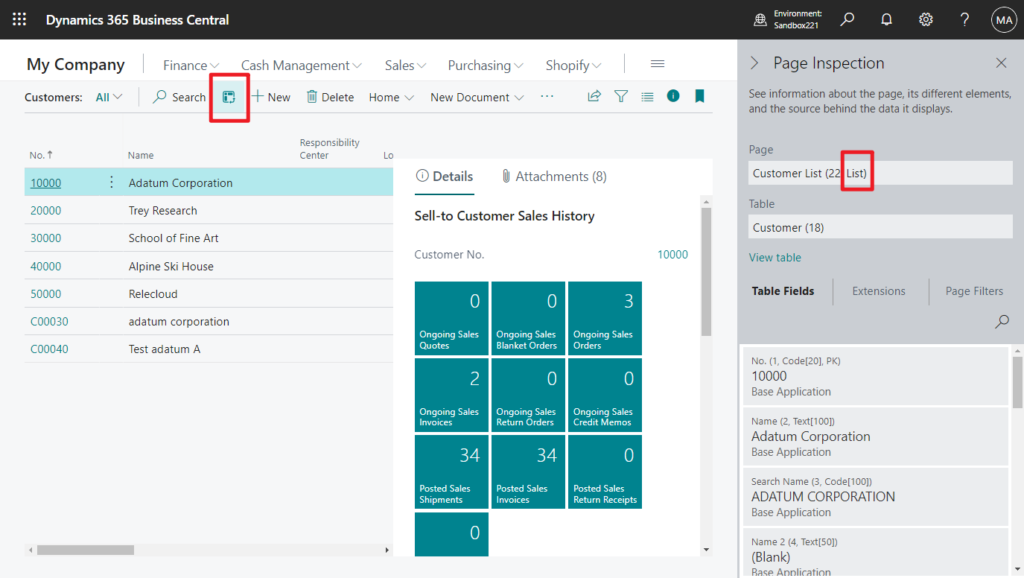
Why? Here is the standard code for these two pages. It’s hard to identify the problem quickly.
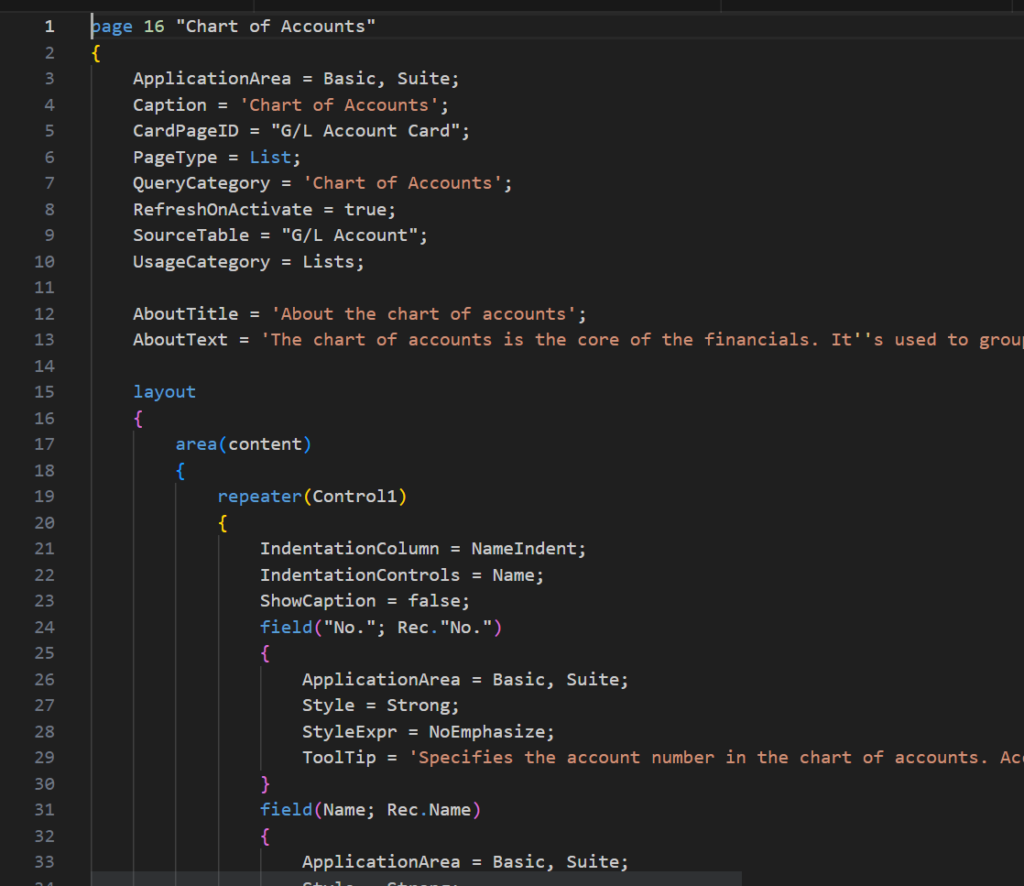
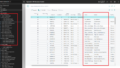
page 16 “Chart of Accounts”:
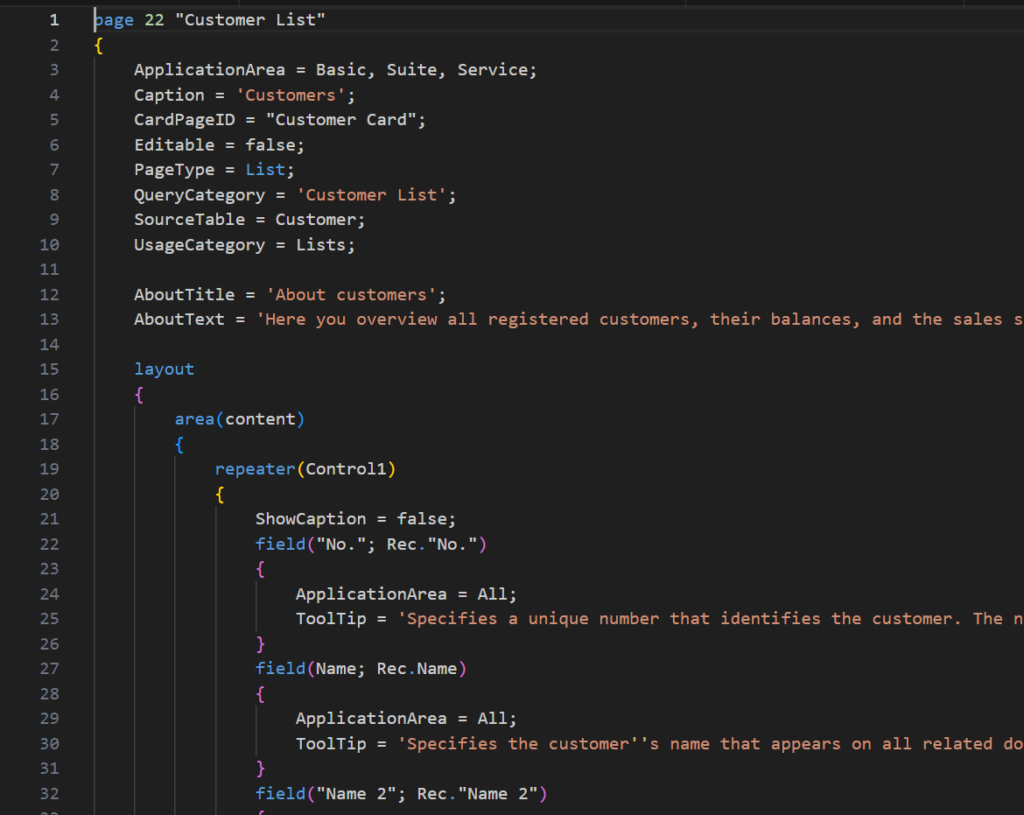
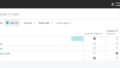
page 22 “Customer List”:
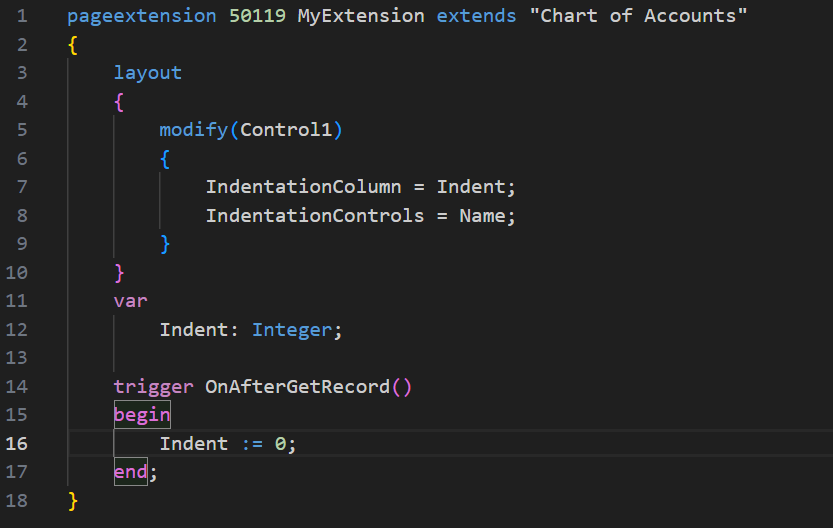
I completely copied page 16 “Chart of Accounts” to create a new page.
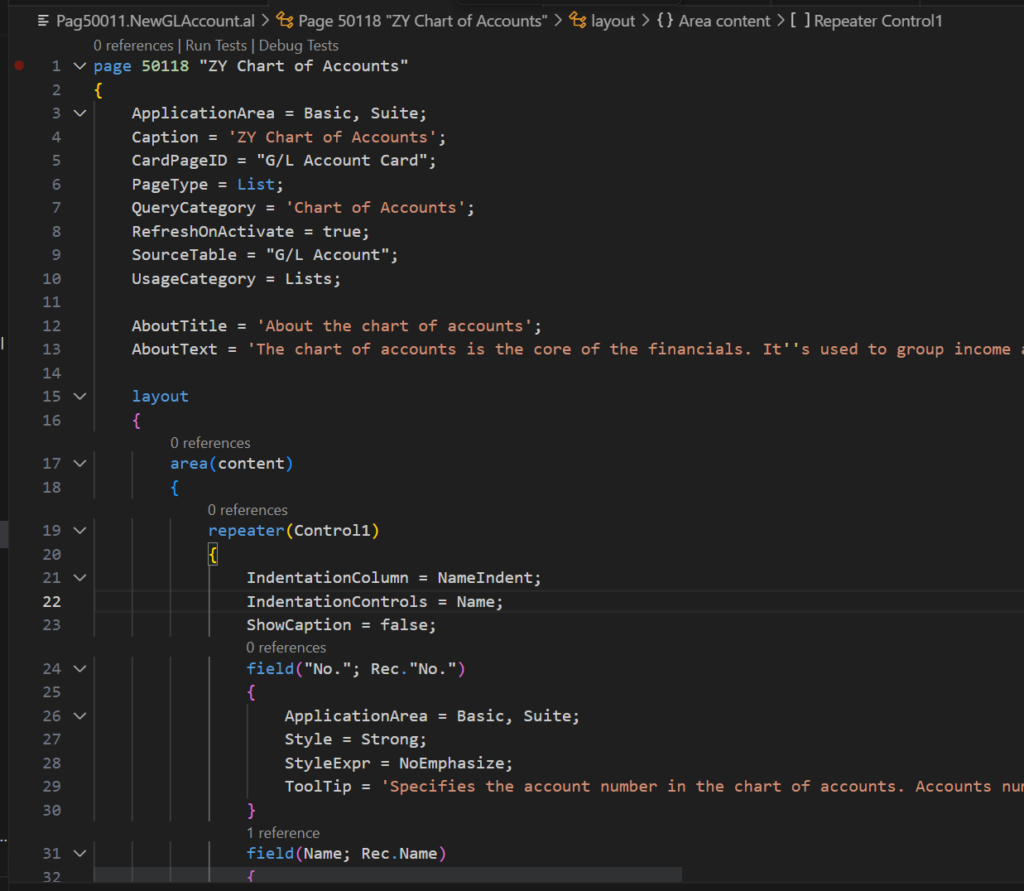
As with standard, you don’t see an icon for data analysis mode. Then I did some tests.
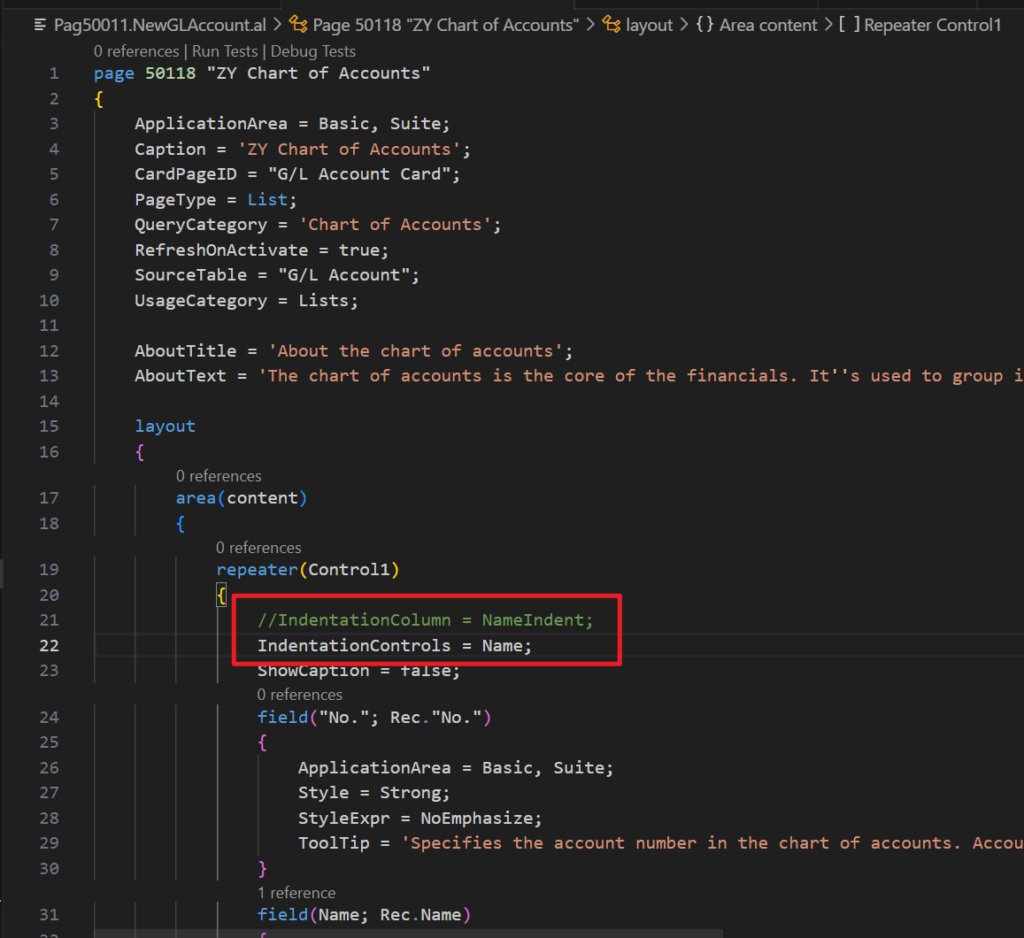
As for the testing process, I will not go into details, from the conclusion that it is caused by the IndentationColumn Property and IndentationControls Property, it looks like the data analysis mode does not support the Indented Hierarchy Lists.
- The IndentationColumn Property determines which records get indented and by how much. You set the property to either a field in the page’s source table or to a variable. The important thing, is that property resolves to an integer. This integer determines the indentation level.
- The IndentationControls property specifies which column in the list gets indented. You can only specify one column.
For more information about how to use this property, see Designing Indented Hierarchy Lists
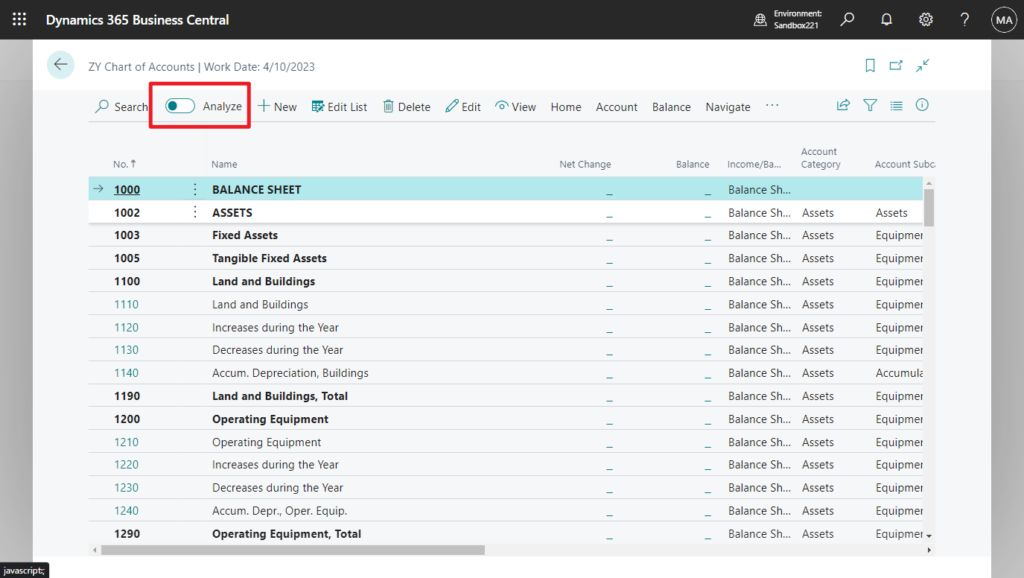
So data analysis mode is resurrected as soon as you comment out any line property (IndentationColumn Property or IndentationControls property).
For example,
The same is true for the following pages
Chart of Accounts Overview (634, List):
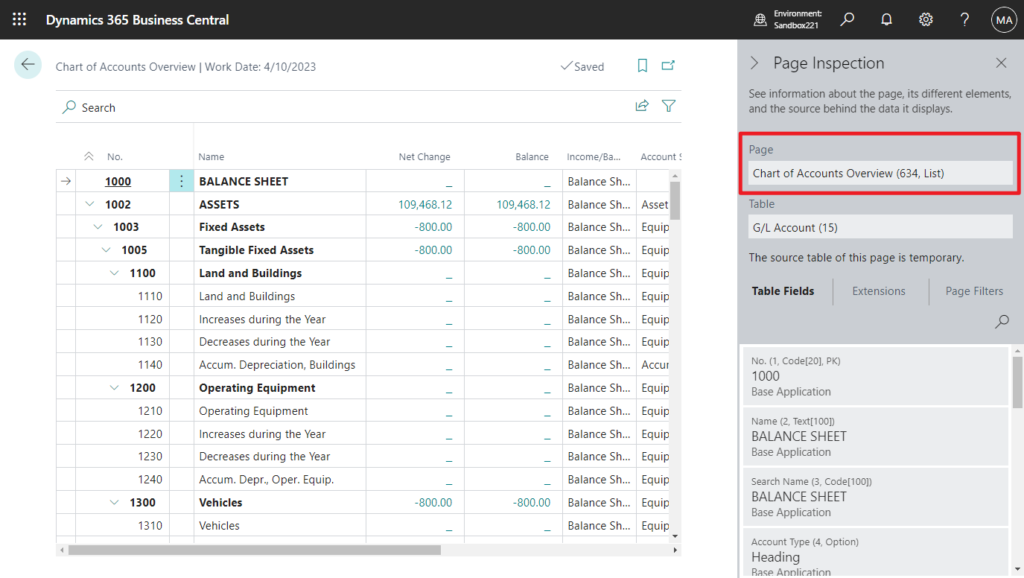
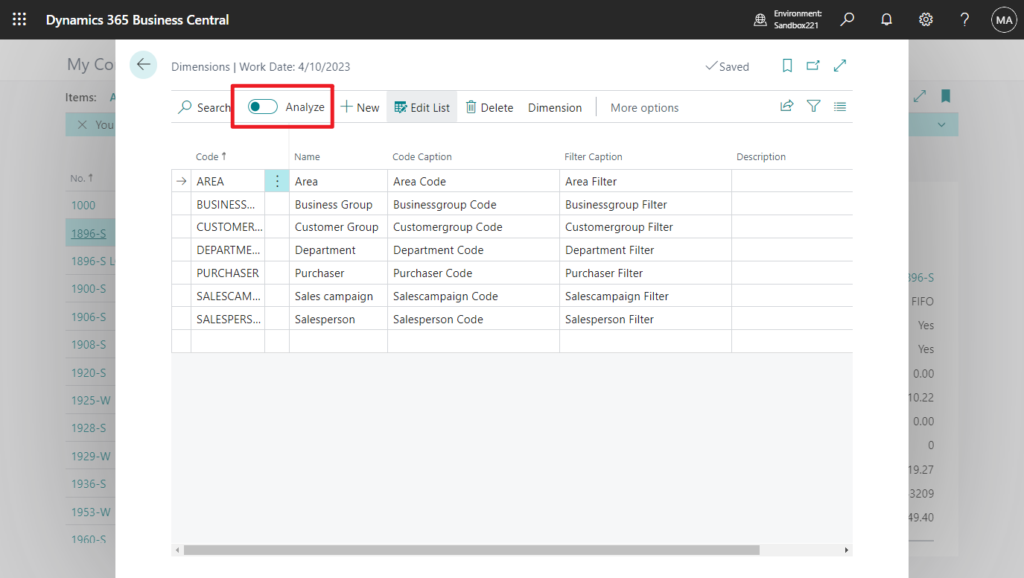
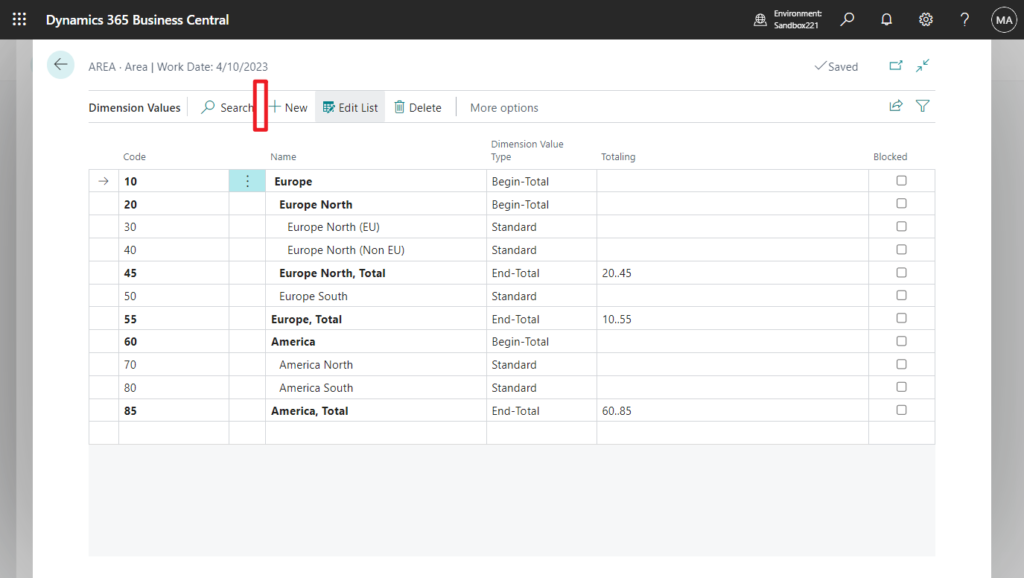
The Dimensions (536, List) page works, but the Dimension Values (537, List) page does not.
Finally, I hope Microsoft will add this information to MS Learn (Docs) Analyze list data using data analysis mode, so that it can help more people.
PS: Since these two properties cannot be disabled, Data Analysis Mode cannot be used even if you use PageExtension to make standard pages lose their indentation.
END
Hope this will help.
Thanks for reading.
ZHU
コメント