Hi, Readers.
The public preview for Dynamics 365 Business Central 2023 release wave 1 (BC22) is available. Learn more: Link.
I will continue to test and share some new features that I hope will be helpful.
Analyze, group, and pivot data on list pages using multiple tabs:
Business value:
End users and data analysts can analyze data from list pages directly in the client without the need to open the page in Excel or run a report.The ability to analyze data directly in list pages raises the bar for what you can do without having to switch applications, while still allowing customers and partners to do more in report objects, Excel, Power BI, or other data analysis applications.
https://learn.microsoft.com/en-us/dynamics365/release-plan/2023wave1/smb/dynamics365-business-central/analyze-group-pivot-data-list-pages-using-multiple-tabs
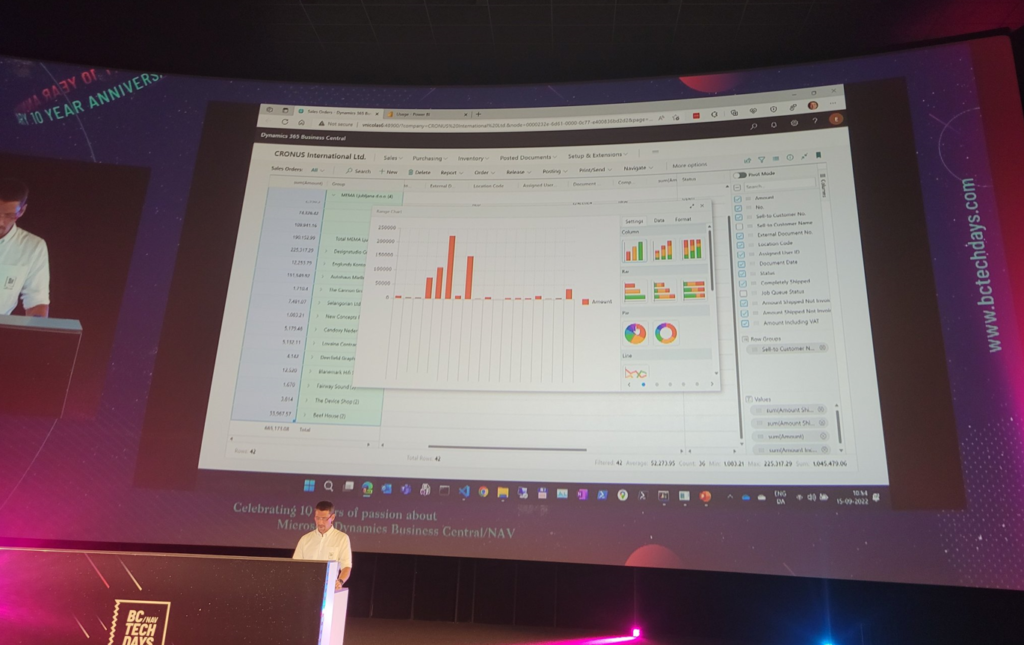
As far as I can remember, the first time Microsoft showed this feature to an external party was at BC TechDays 2022 (Image from Twitter).
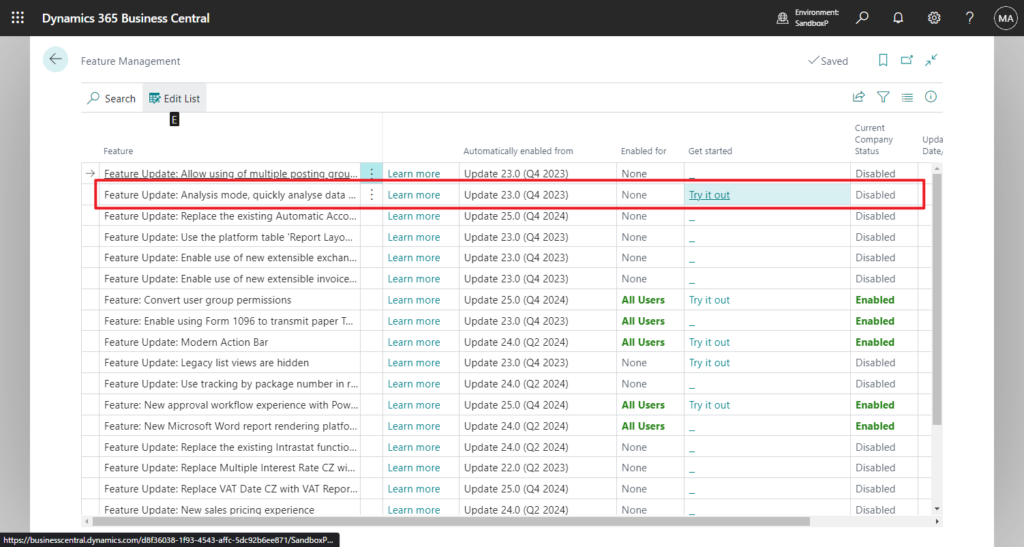
And the feature is in public preview, which means your administrator must turn it on before you can try it out. If you decide it isn’t for you, your administrator can turn it off again. To try it out, go to the Feature Management page and enable Analysis mode.
In 2023 wave 1 (BC22), Microsoft has released some of the features. Let’s see some details.
Analysis mode is a new way of interacting with data on list pages. Instead of running reports using different options and filters, you can simply add multiple tabs that represent different tasks or views on the data. Examples could be “My customers,” “Follow-up items,” “Recently added vendors,” “Sales statistics,” or any other view you want.
When you’re ready to analyze data on a list page (where you might have filtered data using a view or filter pane), simply switch to analysis mode:
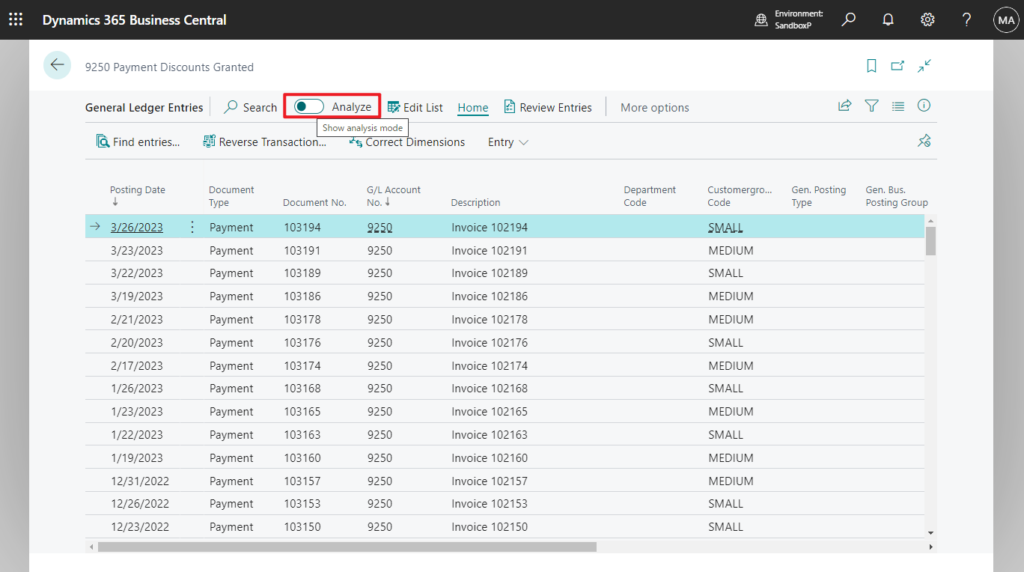
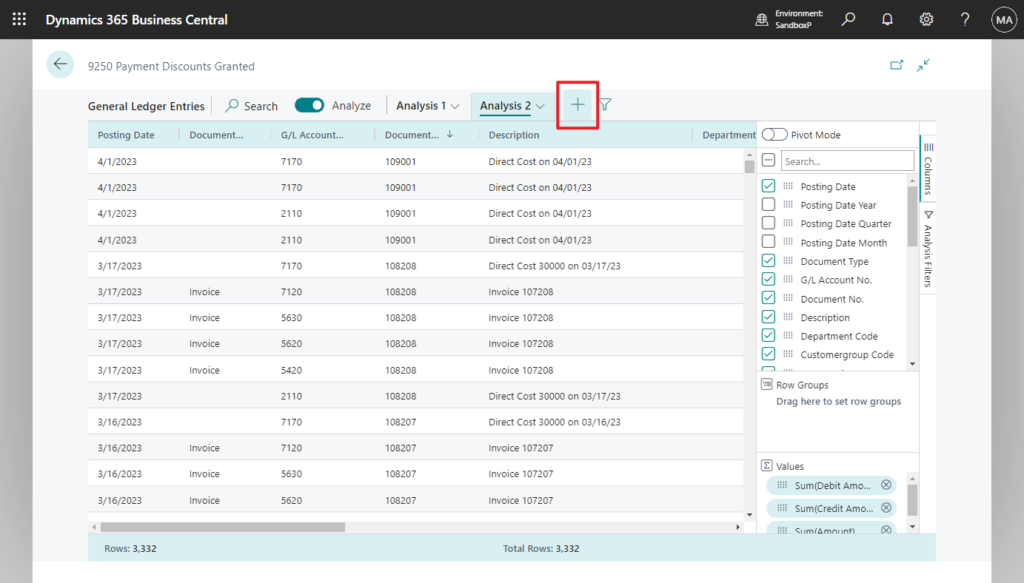
Analysis mode opens the data in a new experience that’s optimized for data analysis. When a page is in analysis mode, it’s split into two areas:
- The main data area (including a Tabs pane)
- The field modifier area
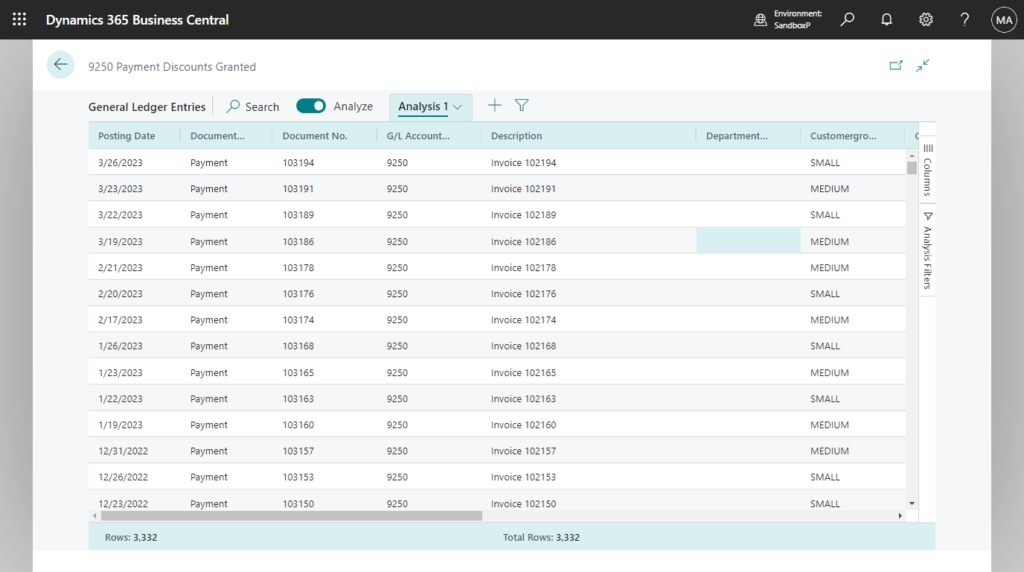
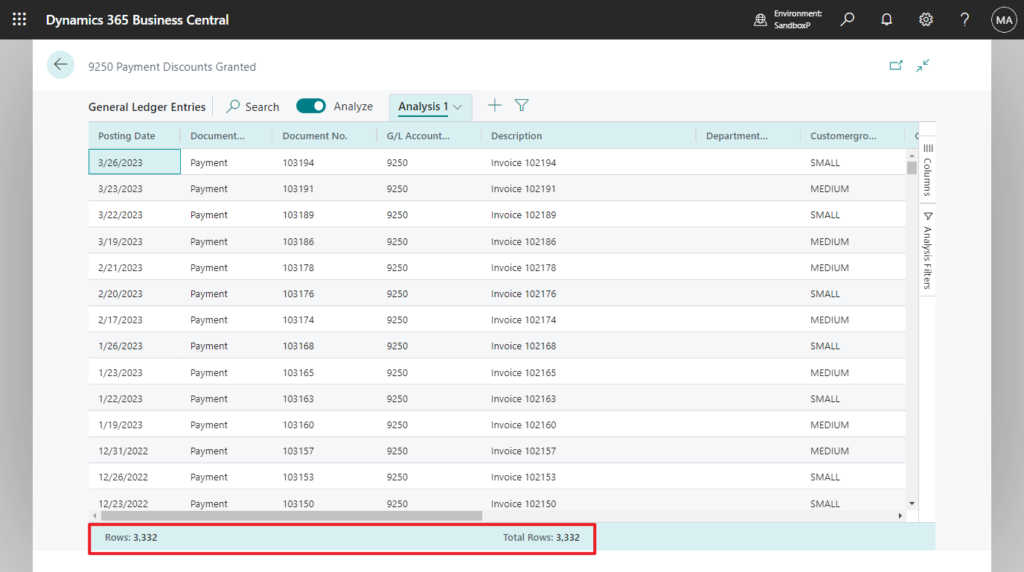
The bottom of the data area shows the total row count on the column.
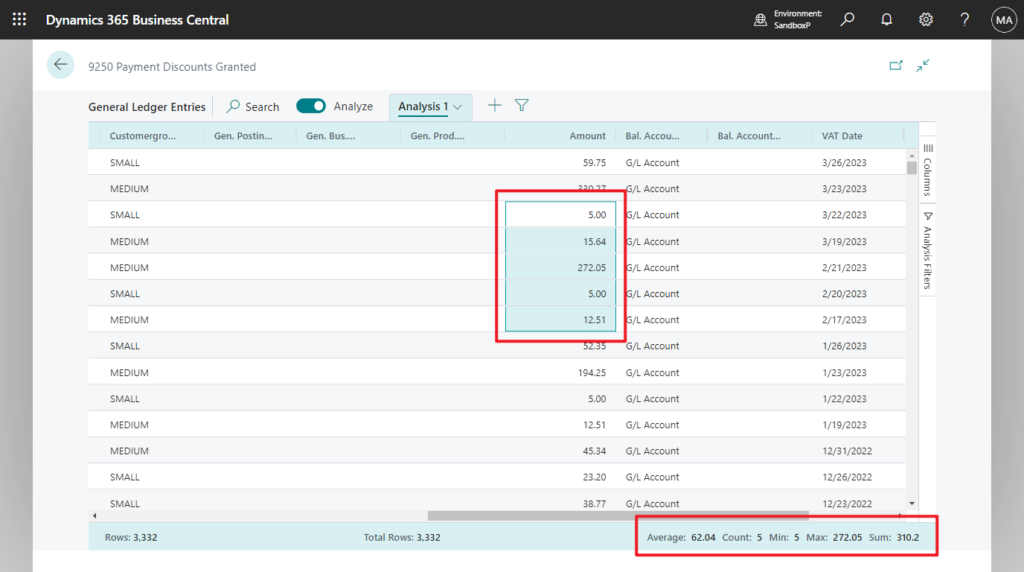
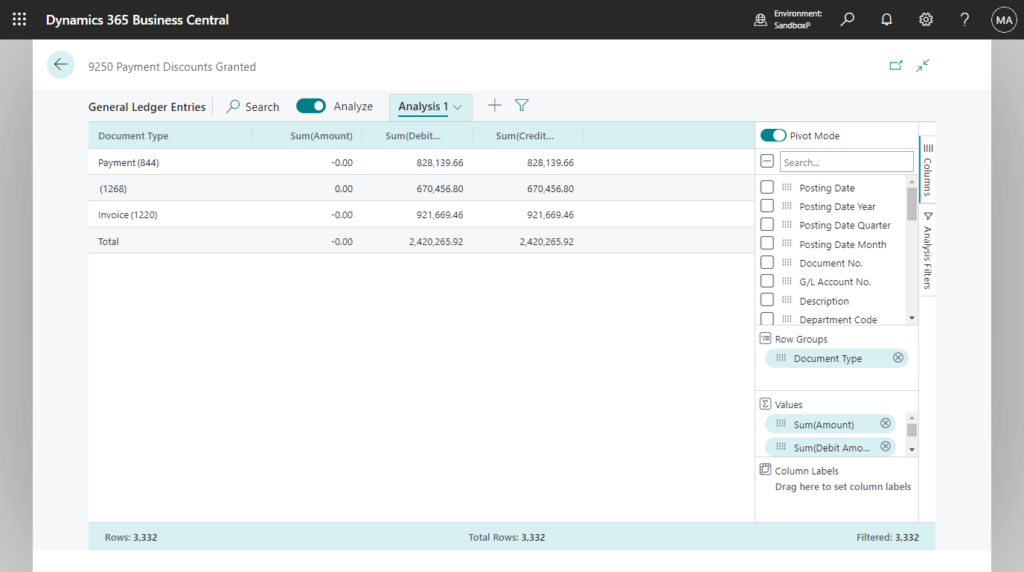
Use the data area to interact with the data. For columns that are summable, you can easily get descriptive statistics on a set of fields by marking them.
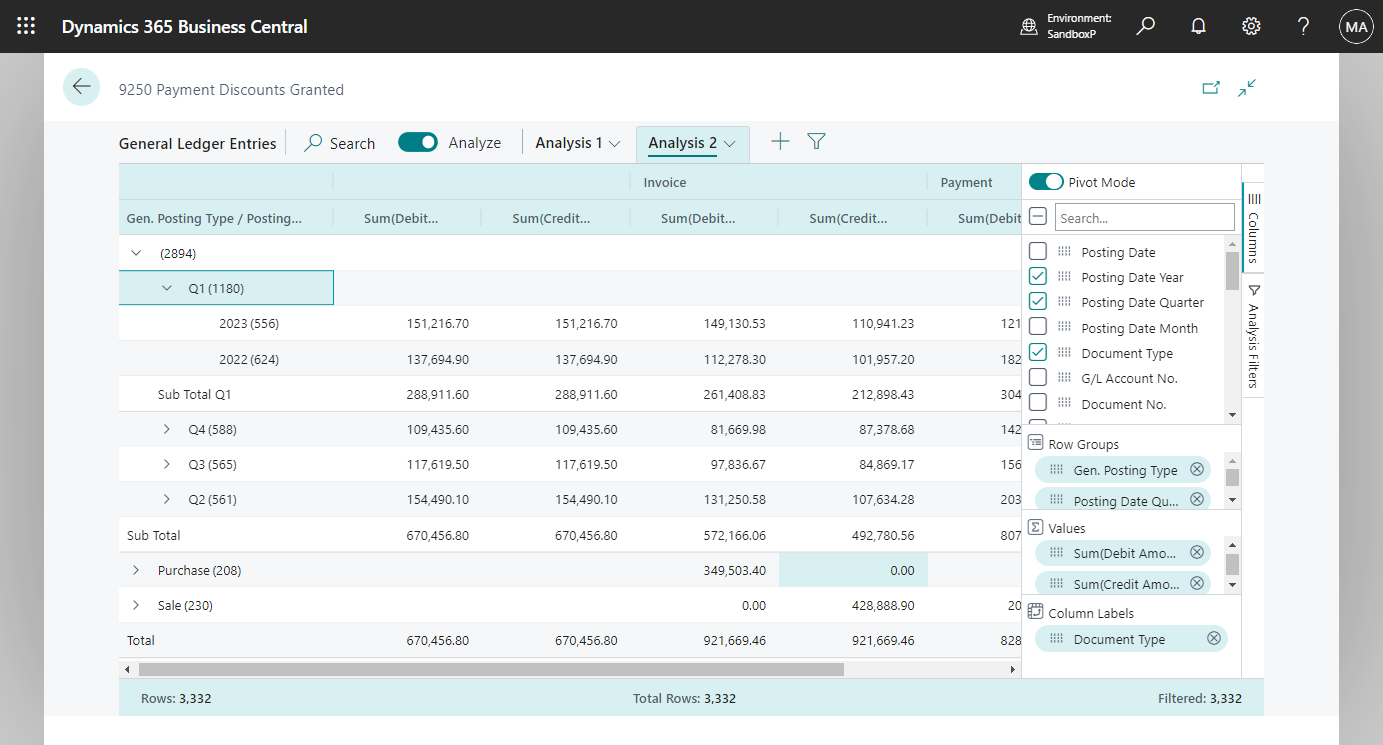
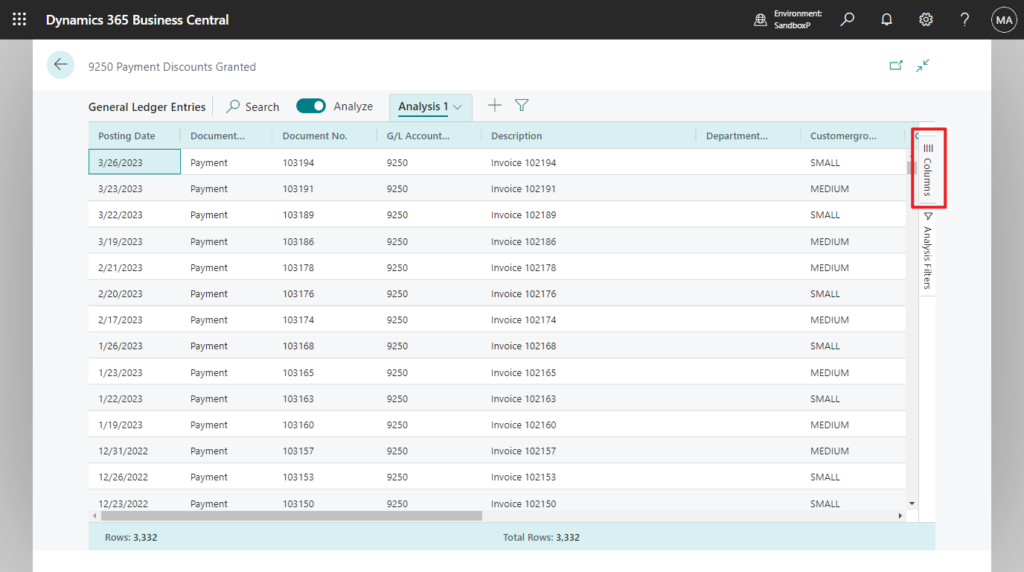
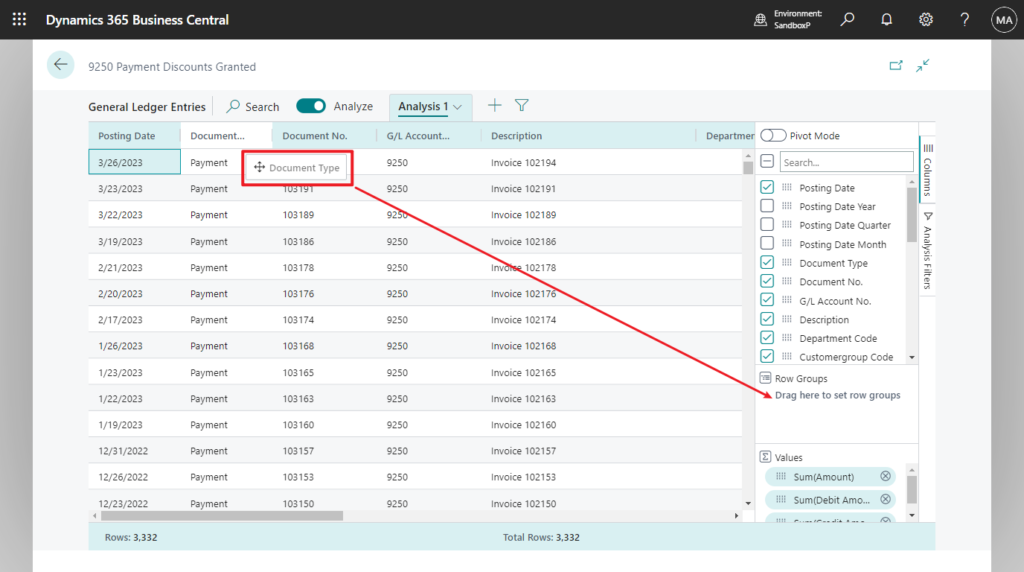
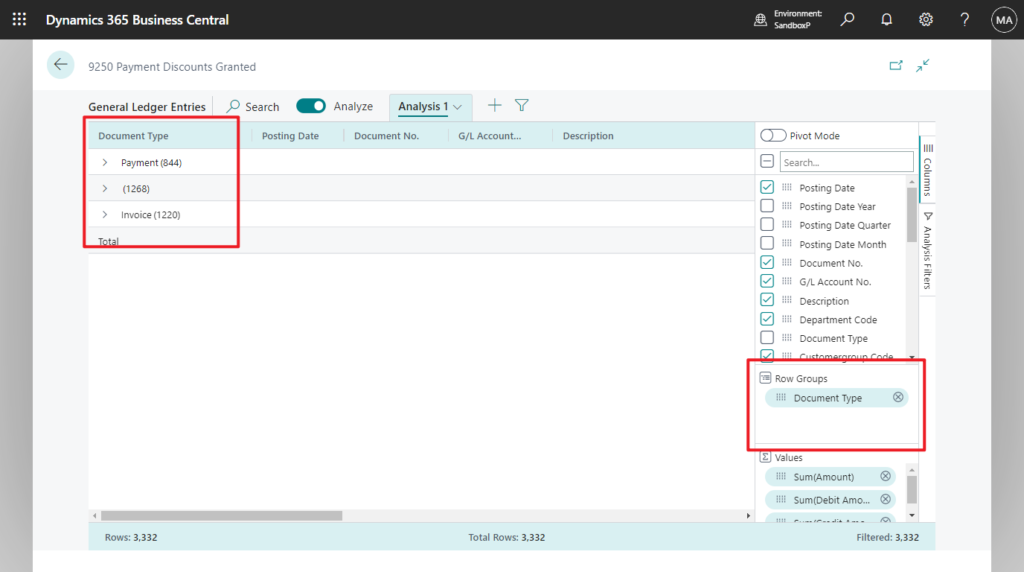
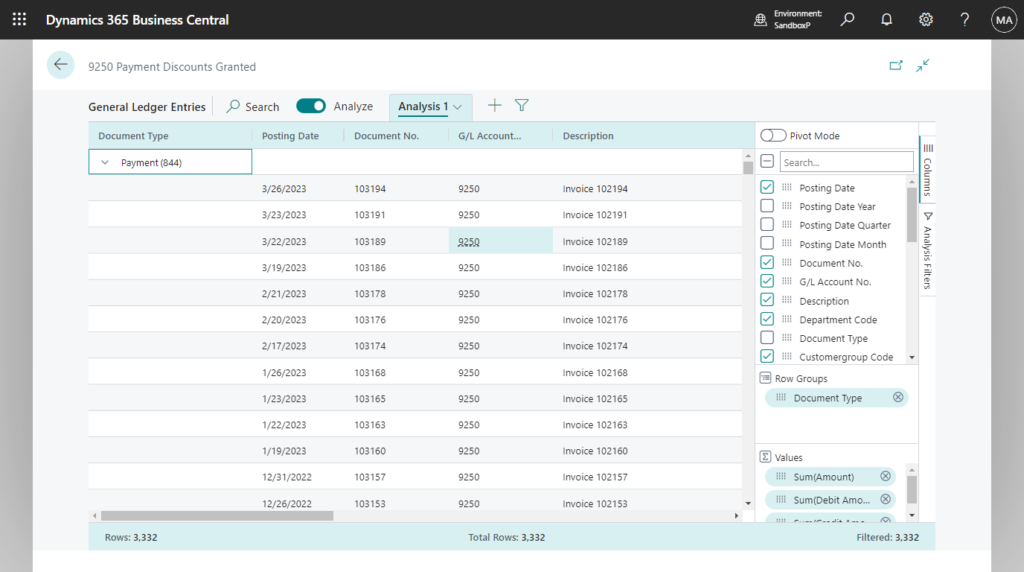
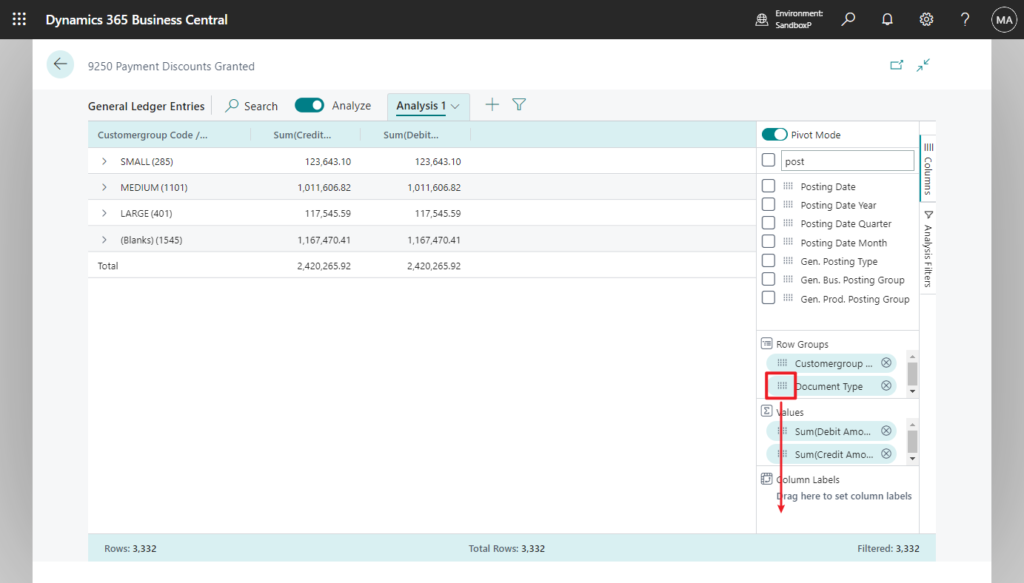
You can group data by dragging fields to the Grouping part of the Columns menu. This lets you explore data grouped by one or more fields to the left of the data area. This is a bit like the PivotTable in Excel.
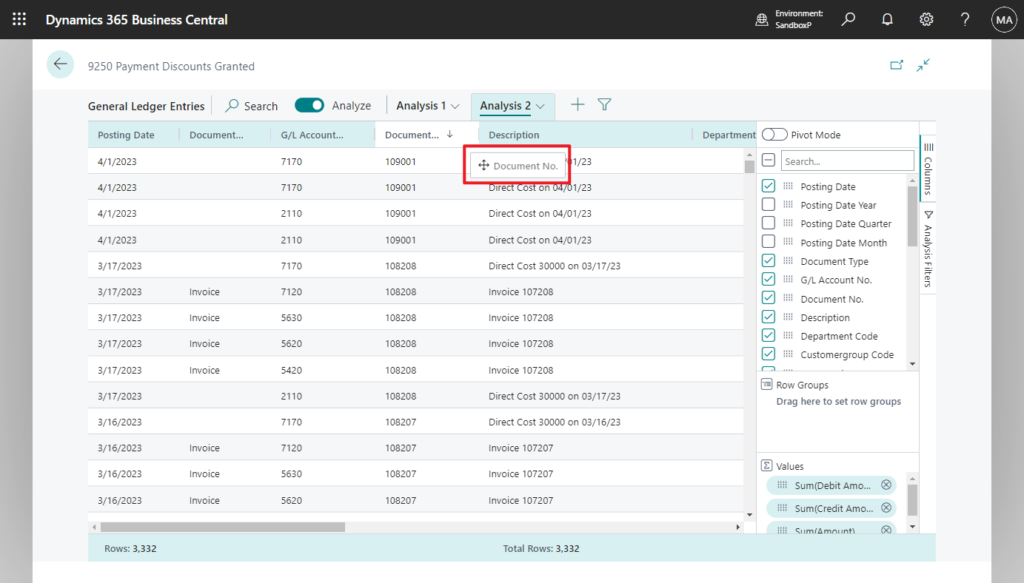
Grouping works great in pivot mode. To enable pivot mode, turn on the Pivot Mode toggle switch and then drag fields that are to be summed to the Values part.
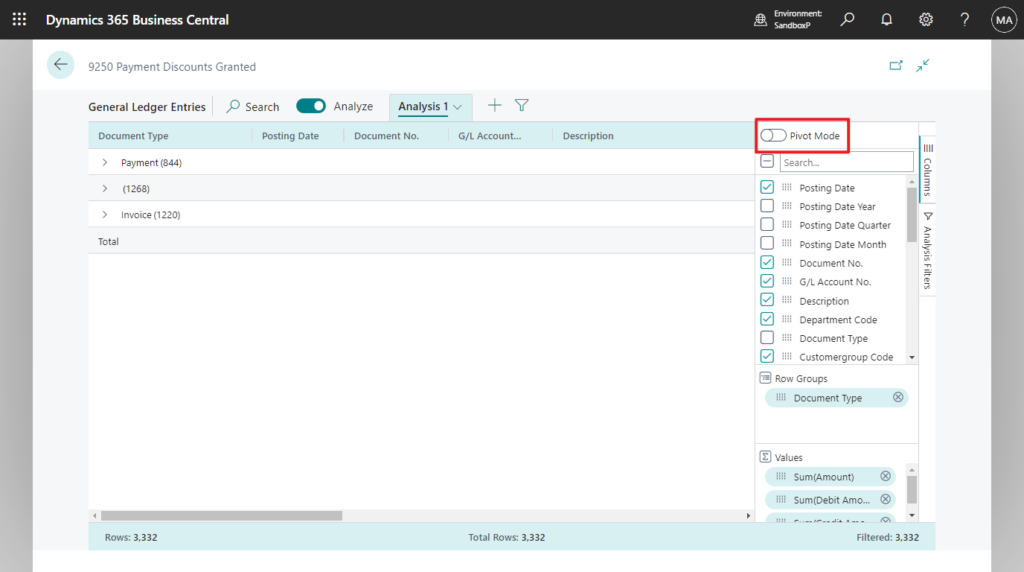
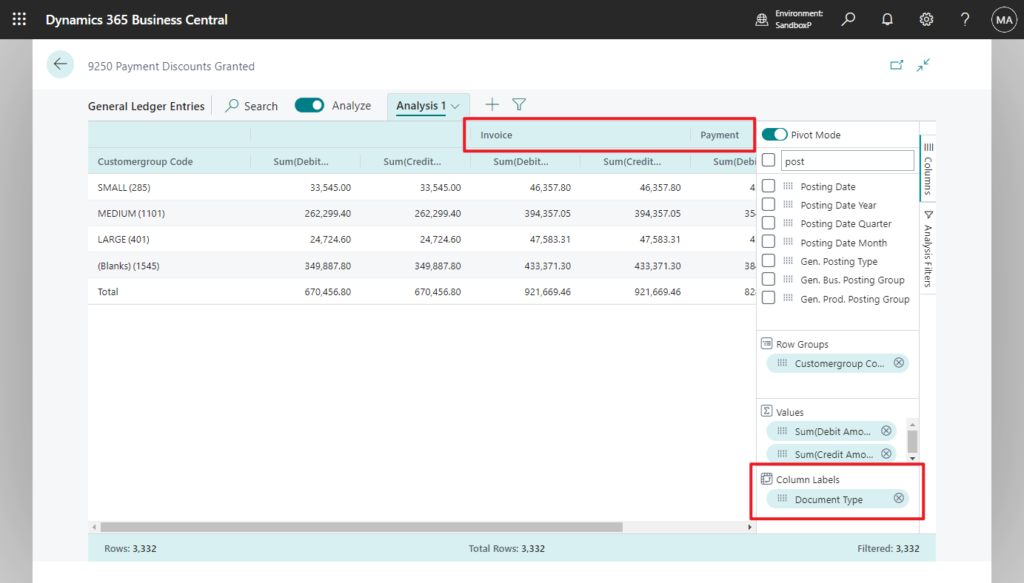
In pivot mode, you can define groups that show up in the column part of the data area. Do this by dragging fields to the Column Labels part of the Columns menu.
Column grouping works best if the grouping field only contains a few values.
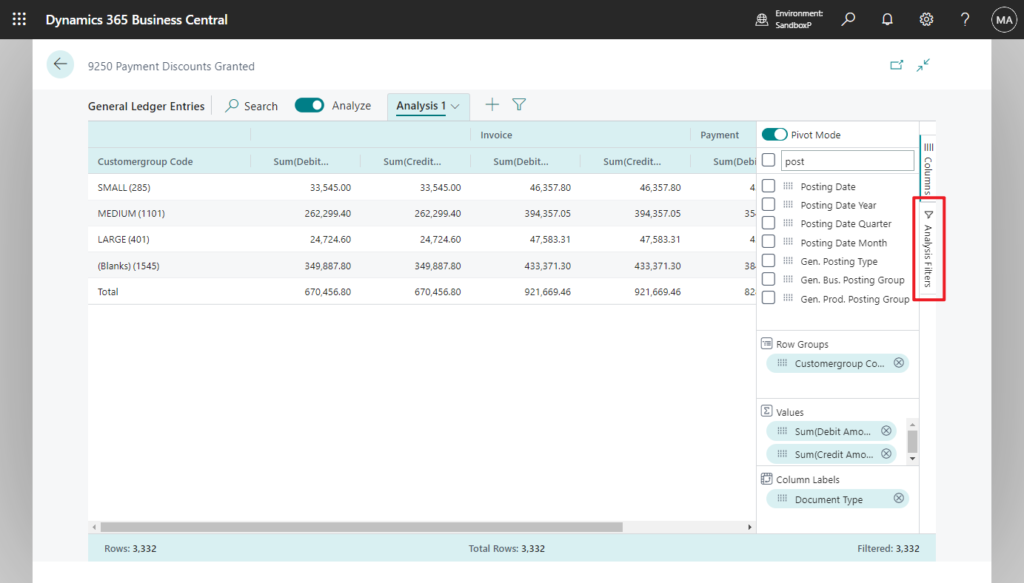
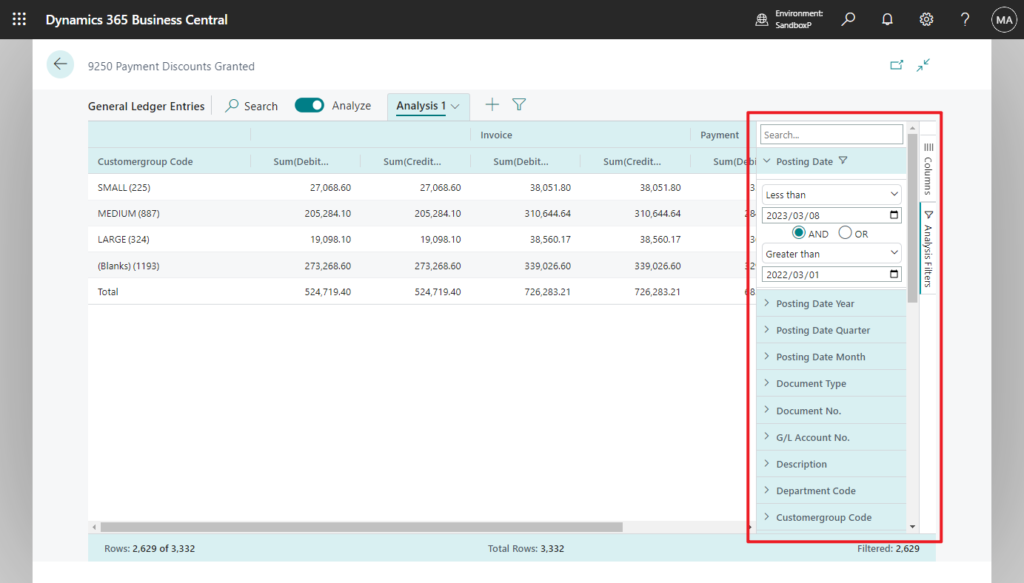
Use the Additional Filters menu of the field modifier area to apply more filters to the dataset. In this part of an analysis, you might want to focus on a specific customer or period of time.
The data area gives you rich control of the layout of columns.
- Drag columns to where they make the most sense in your analysis.
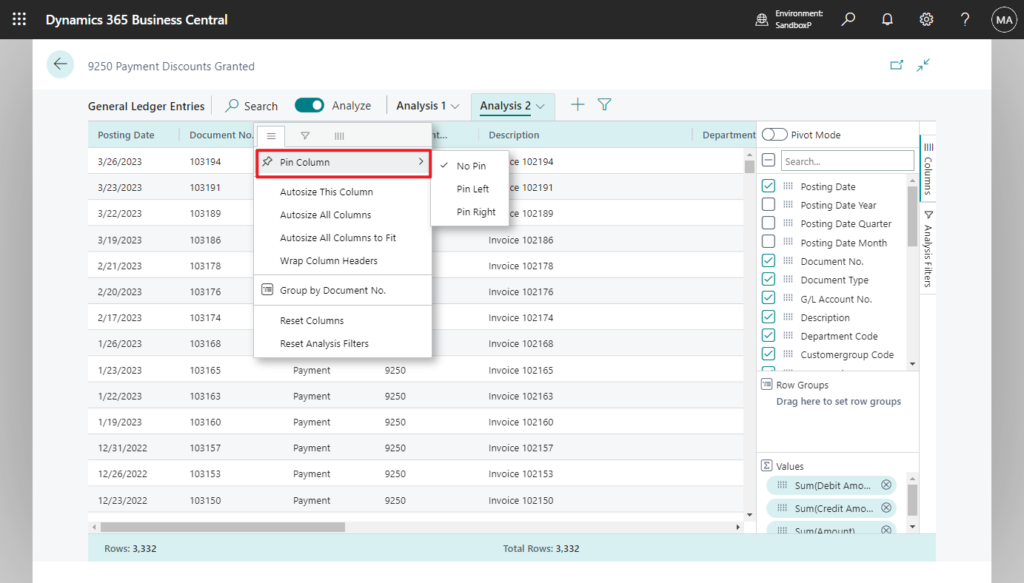
- Pin a column to the left or right side of the column part.
- Define data filters directly on the column definition instead of going to the field modifier area. You can still peek in on details about related data and for each line and open the card to learn more about a given entity.
Business Central can save multiple column setups and filters. The next time you switch to analysis mode you can dive straight in to analyzing data. On the Tabs pane, you can rename or remove a tab.
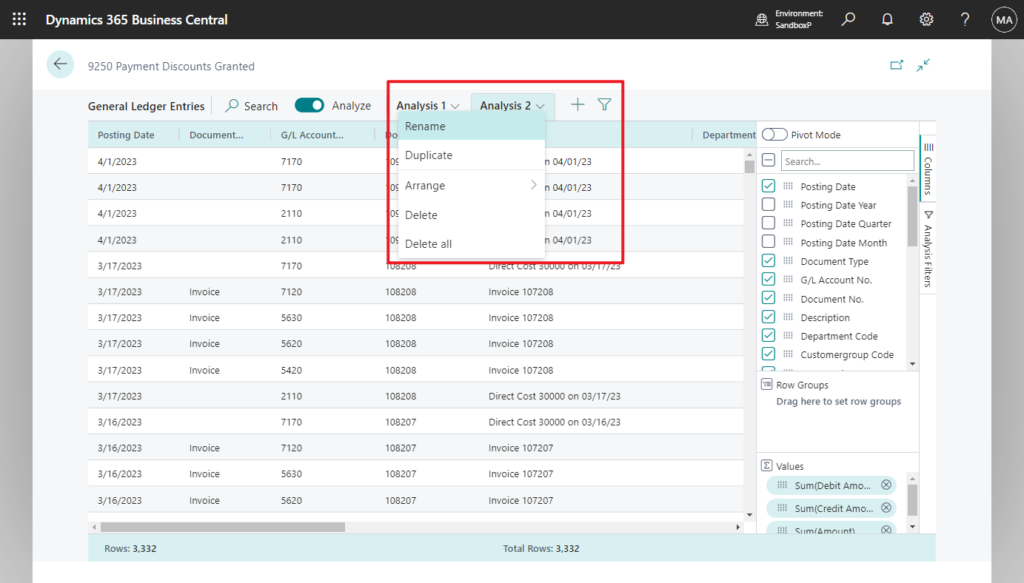
The Tabs pane also lets you add new tabs.
Using tabs allows you to save different setups that you frequently use to analyze a dataset. For example, you might have tabs for analyzing data with pivot mode, and other tabs that filter to a subset of rows. Some tabs might show a detailed view with many columns, and others only display a few key columns.
These tabs are saved for your use only.
PS: How much data can I analyze?
On a list page, as a starting point you can set filters to limit the data. Maybe you want to analyze a certain group of customers, or maybe you want data from the current year only. You can also choose a page view to perform this action. You don’t have to do this prefiltering step, but going to analysis mode will load all data into your browser, so it might be needed for larger datasets (currently above 100,000 rows).
More details: BCTech/samples/AnalyzeData/ (From KennieNP)
Business Central Launch Event (2023 release wave 1)
END
Hope this will help.
Thanks for reading.
ZHU
コメント