Hi, Readers.
In Business Central 2022 wave 1 (BC20), Microsoft has brought us new Excel layouts for BC Reports. With Excel layouts, users can now create and edit report layouts simply by using the full palette of capabilities in Excel such as sliders, diagrams, charts, and pivot tables.
And in the previous release, Business Central 2021 wave 2 (BC19), Microsoft also enhanced Excel feature. More details: Enhancements to working with Microsoft Excel.
In this post, I would like to talk about another way to enjoy working with Excel, set Business Central data to show in Excel Organization Data Types Gallery.
This is not really a new feature, as Microsoft introduced the Data Types Gallery back in 2020. More details: Introducing Excel Organization data types from Power BI
Briefly, in the Data Types Gallery in Excel, users can find data from featured tables in your Power BI datasets.
As you know, we can use Power BI to connect data from Business Central, so using featured tables feature, we can also set Business Central data to show in Excel Data Types.
Let’s try it together.
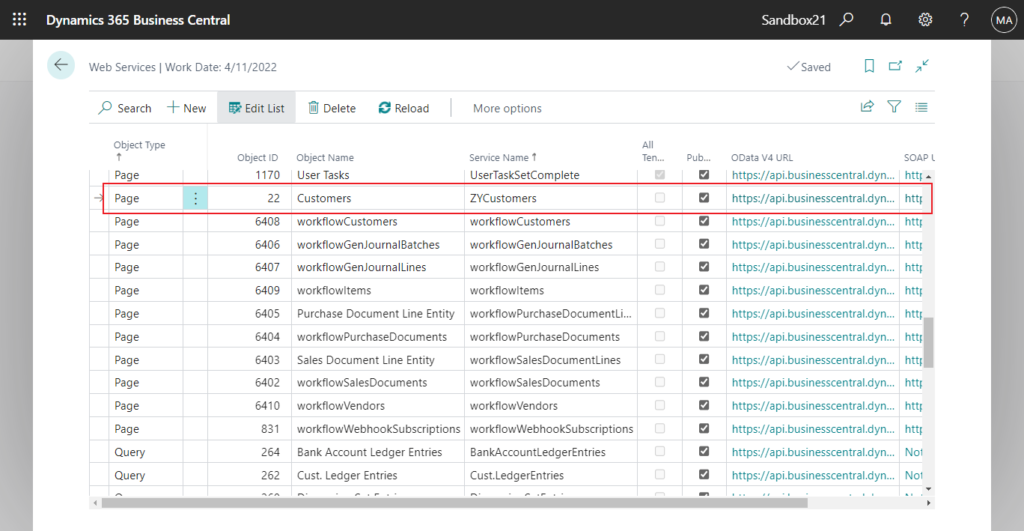
First of all, to ease testing, I published the standard Customer (22) page to the Web Services. This is not required, as Power BI can connect to all standard web services and APIs published in BC.
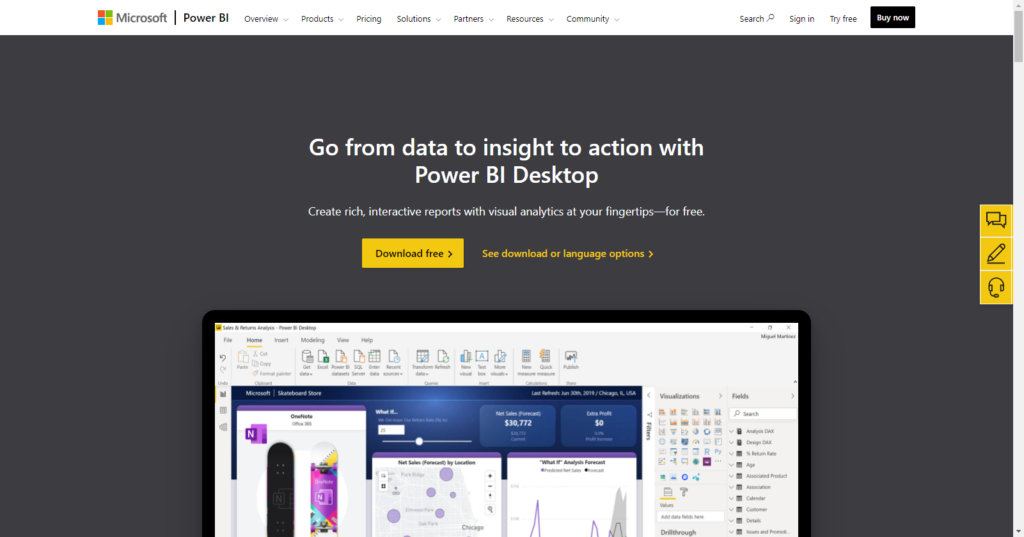
Another required tool is Power BI Desktop. Please download and install it.
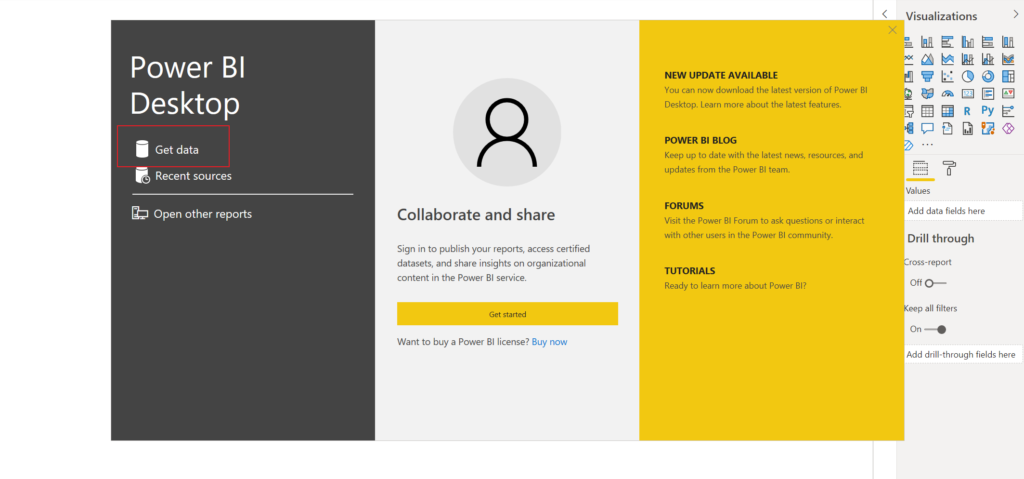
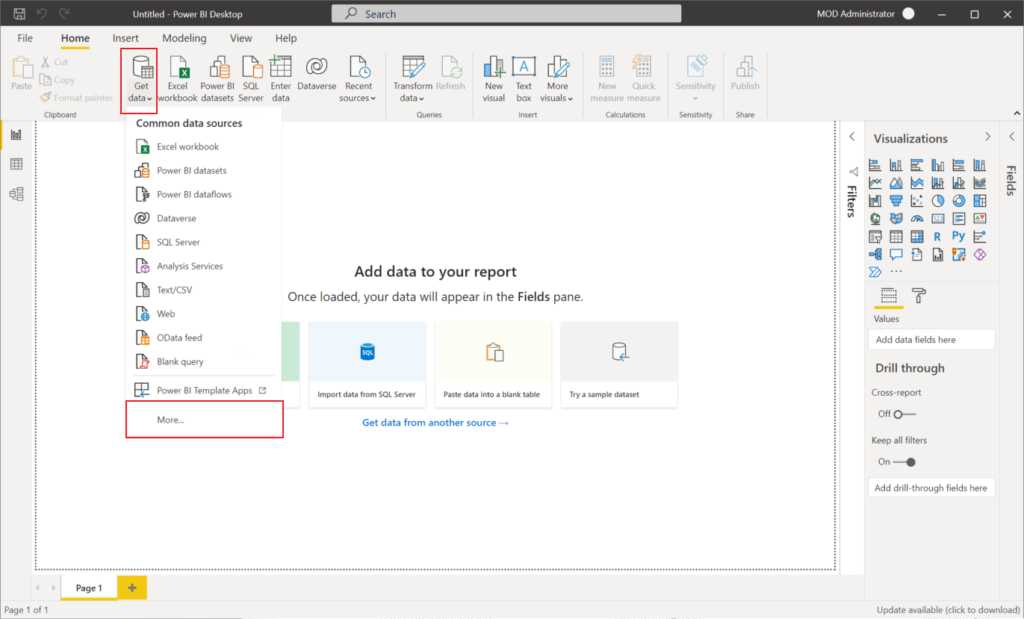
Then open Power BI Desktop, choose Get data -> More…
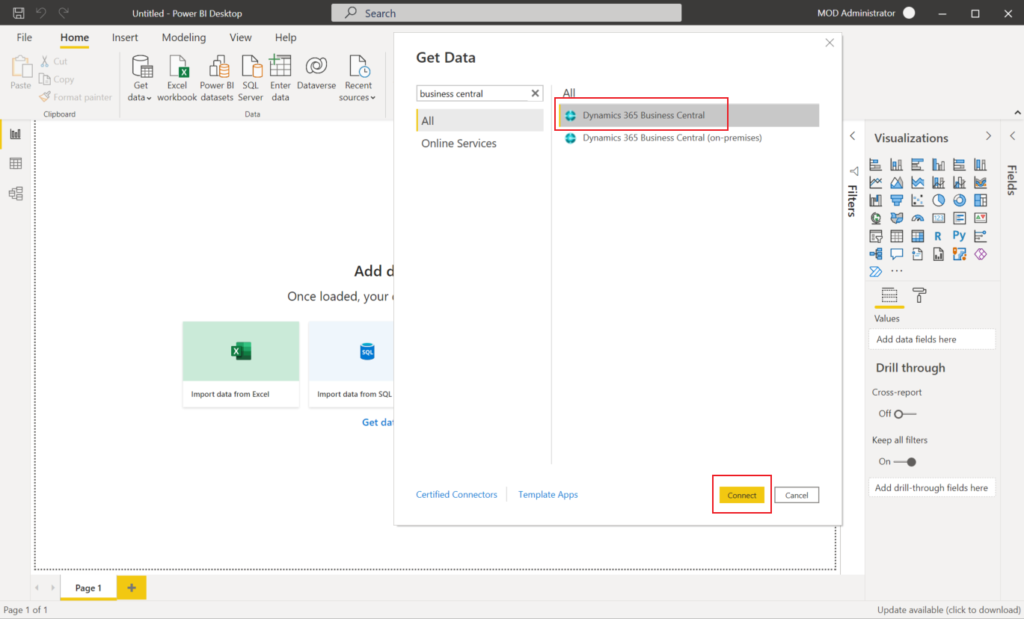
Find Dynamics 365 Business Central and choose Connect. (This feature is also available for the On-Premise)
Then open your test environment.
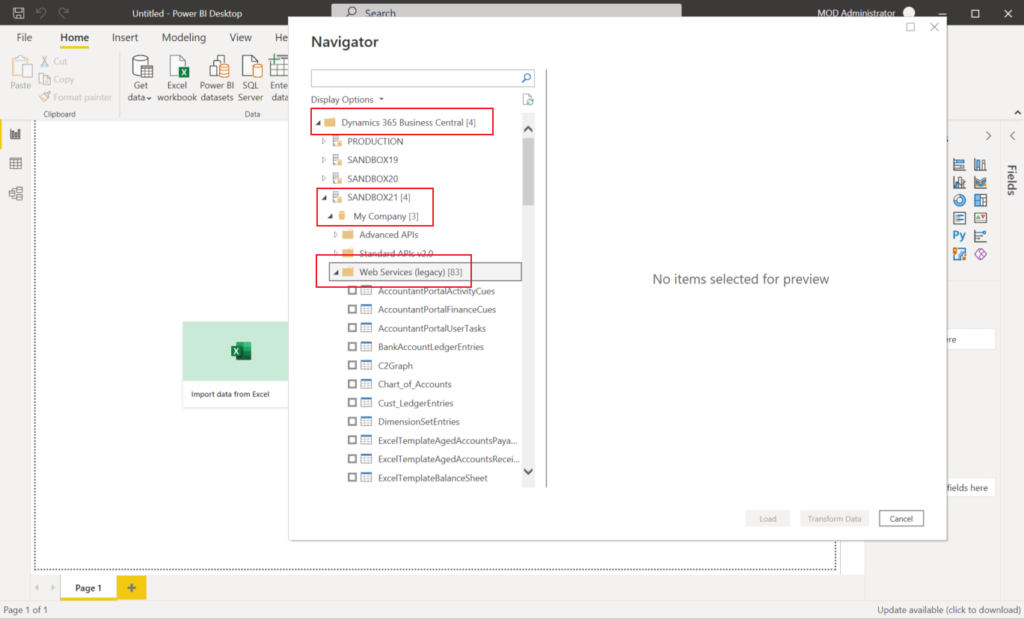
Find the web service I published, choose Load.
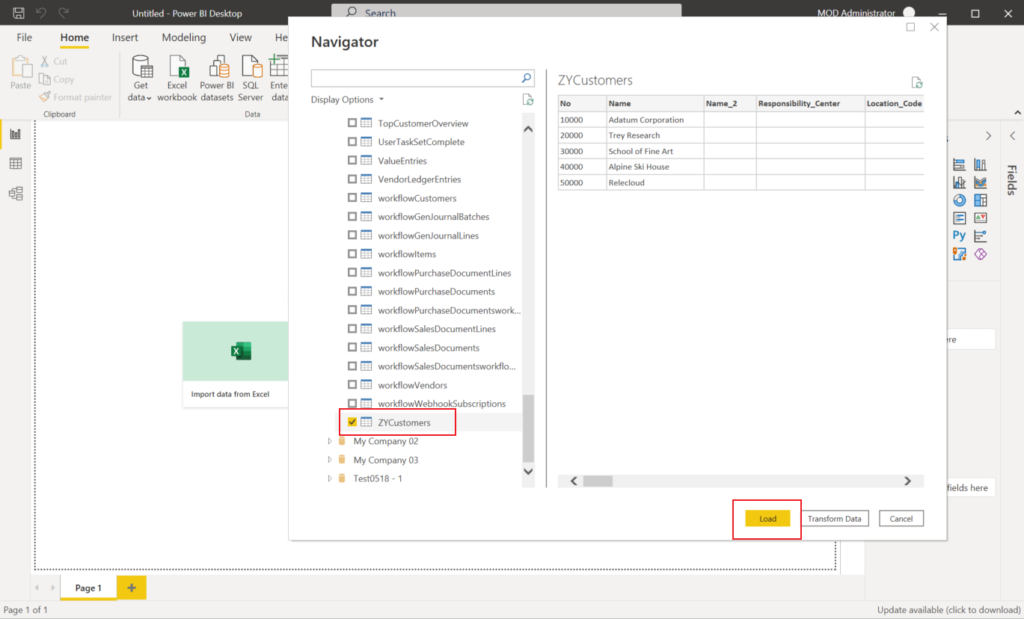
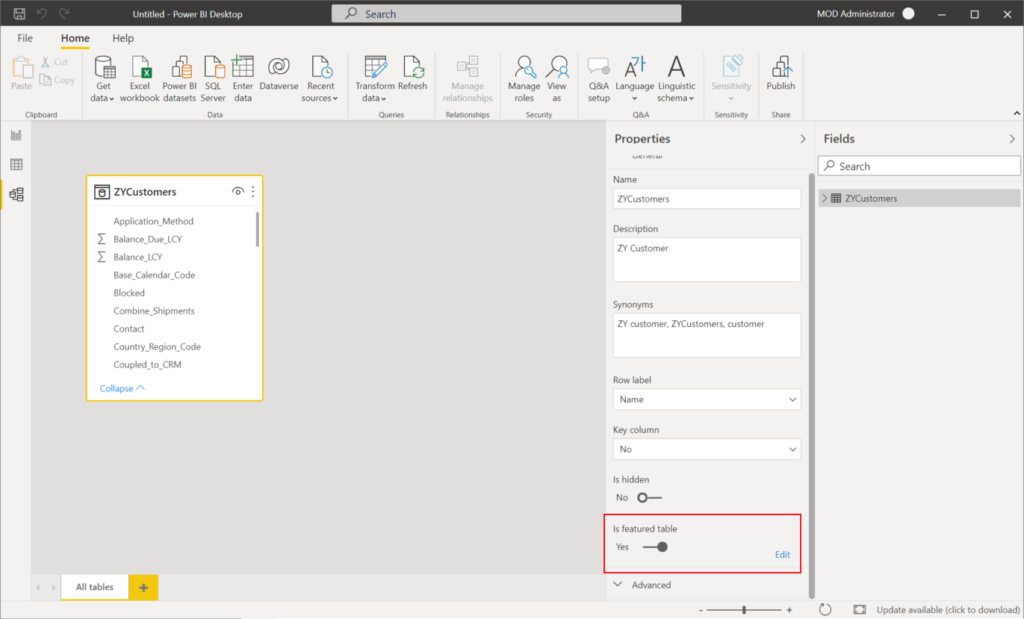
Now you can find the table in Model view.
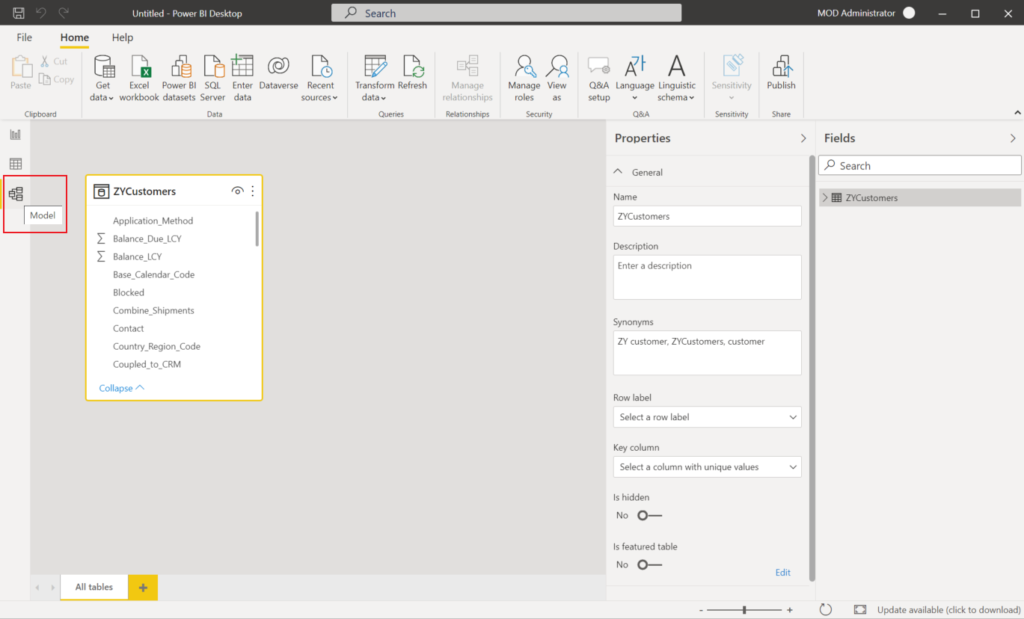
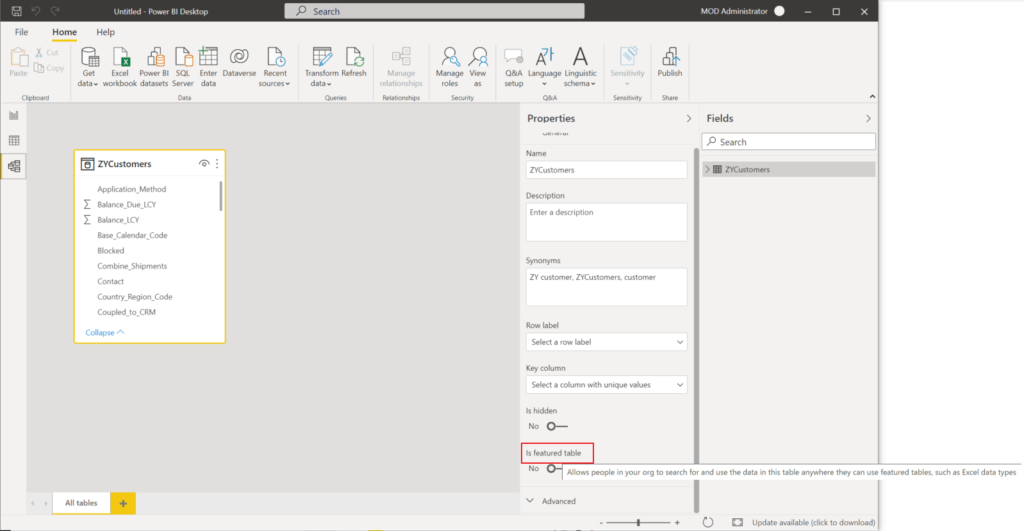
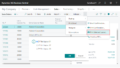
Select the table, and set Is featured table to Yes.
Is featured table:
Allows people in your org to search for and use the data in this table anywhere they can use featured tables, such as Excel data types.
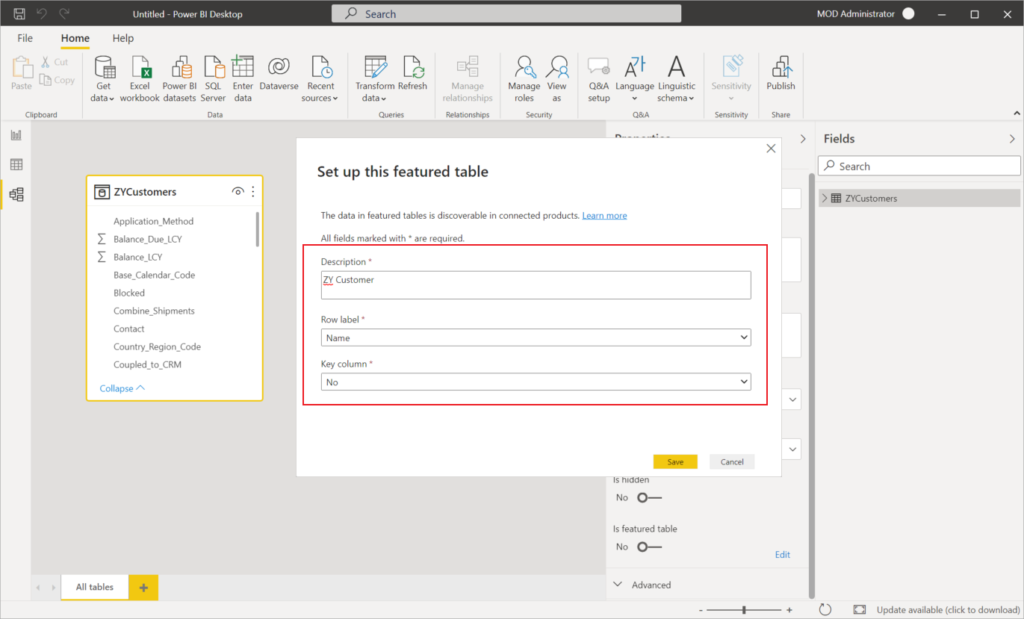
In Set up this featured table, provide the required fields:
- A Description.
Tip
Start the description with “Featured table” to help Power BI report creators identify it.
- The Row label field value is used in Excel so users can easily identify the row. It appears as the cell value for a linked cell, in the Data Selector pane, and in the Information card.
- The Key column field value provides the unique ID for the row. This value enables Excel to link a cell to a specific row in the table.
For example:
Description: ZY Customer
Row label: Name
Key column: No
Is featured table is enabled.
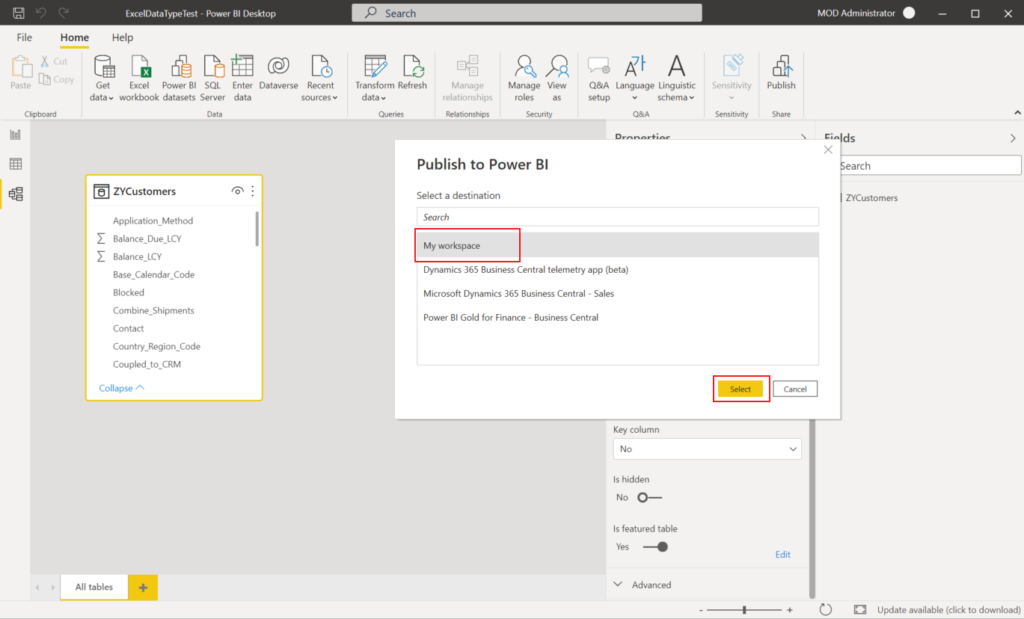
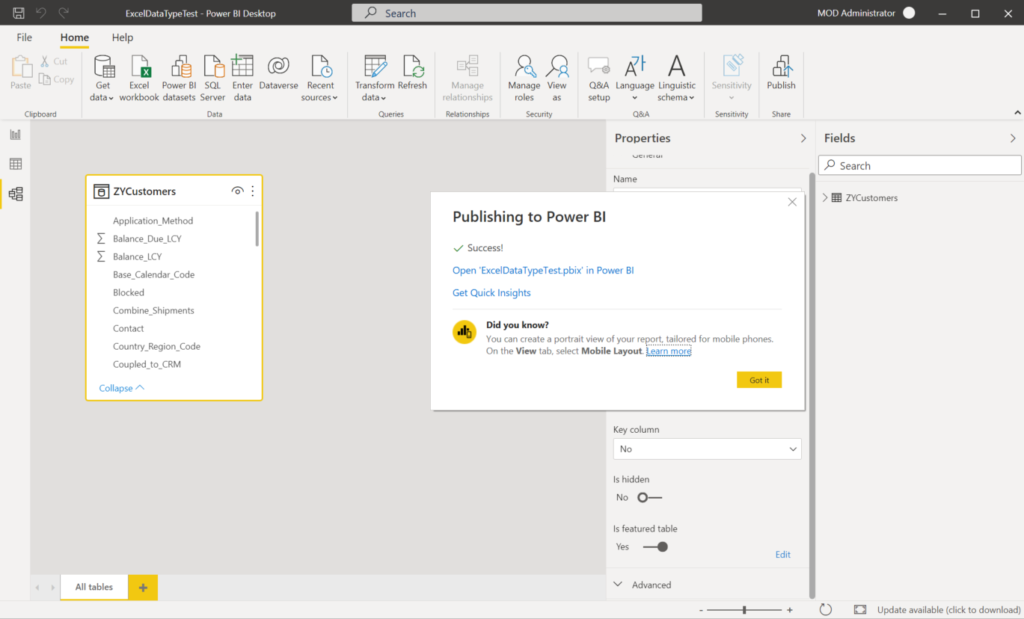
After you publish or import the dataset to the Power BI service, the featured table wil be displayed in the Excel Data Types Gallery.
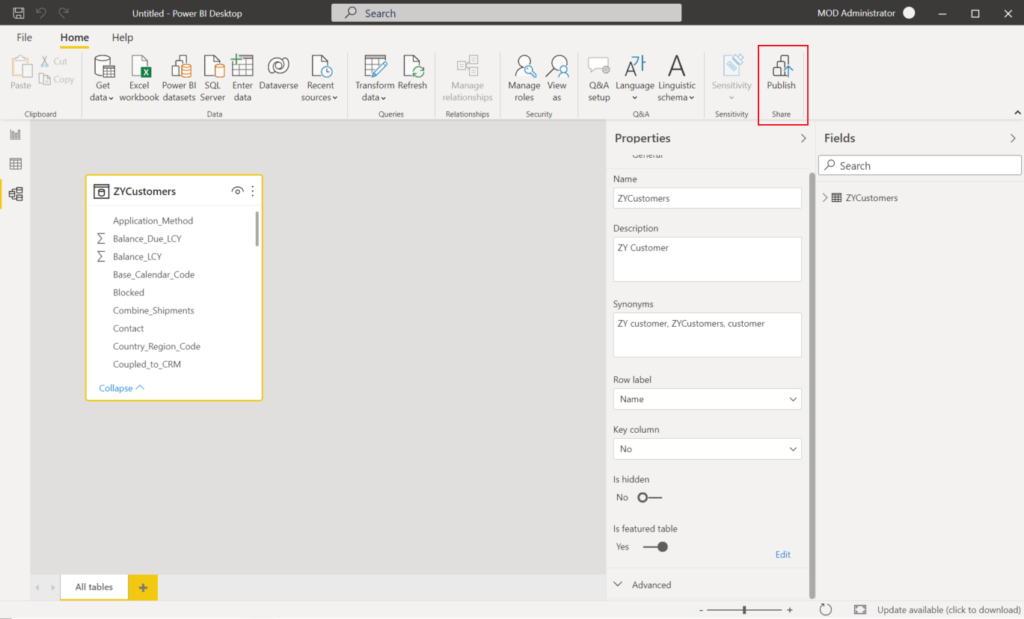
Excel caches the list of data types so you need to restart Excel to see newly published featured tables.
How to use?
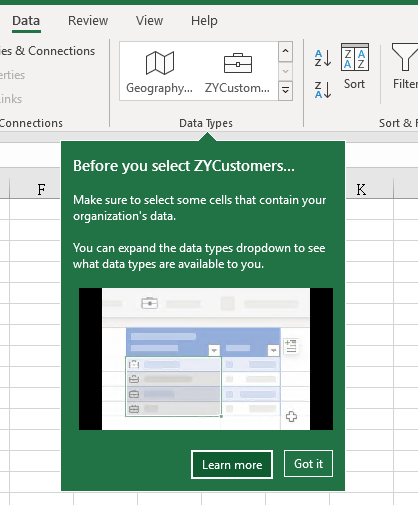
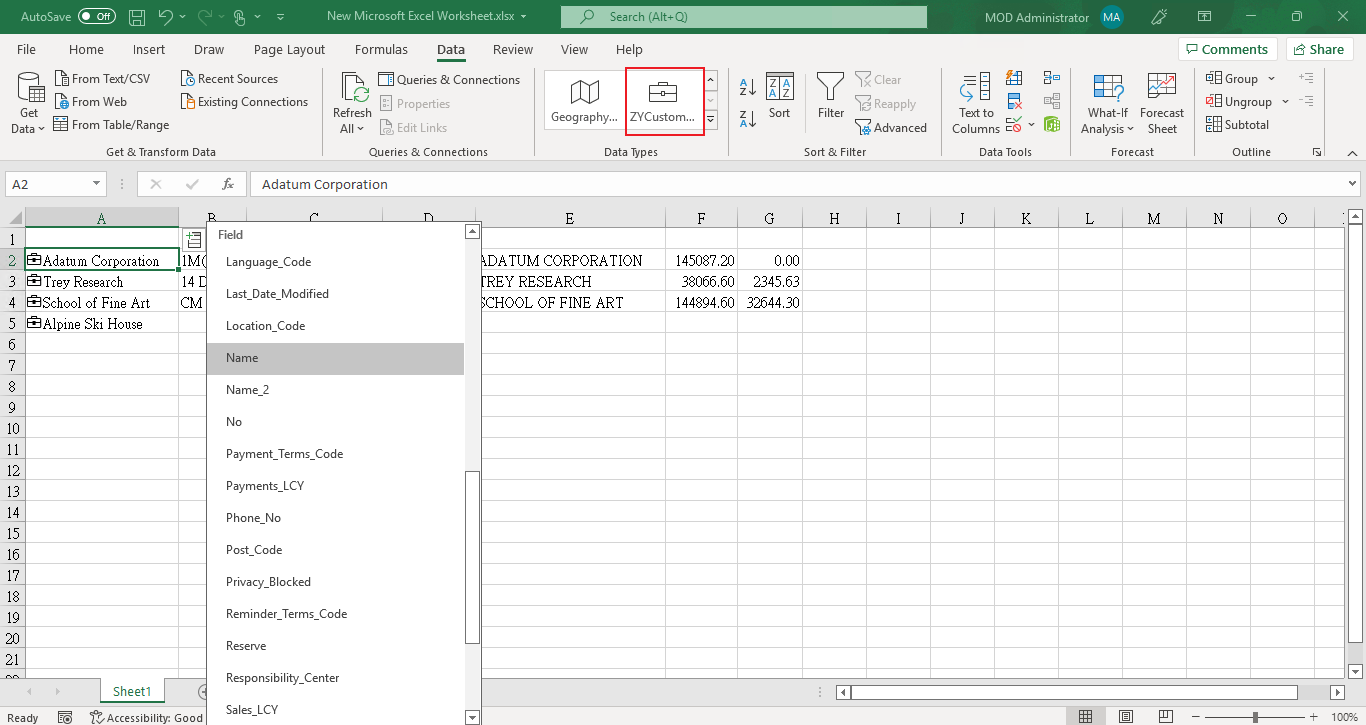
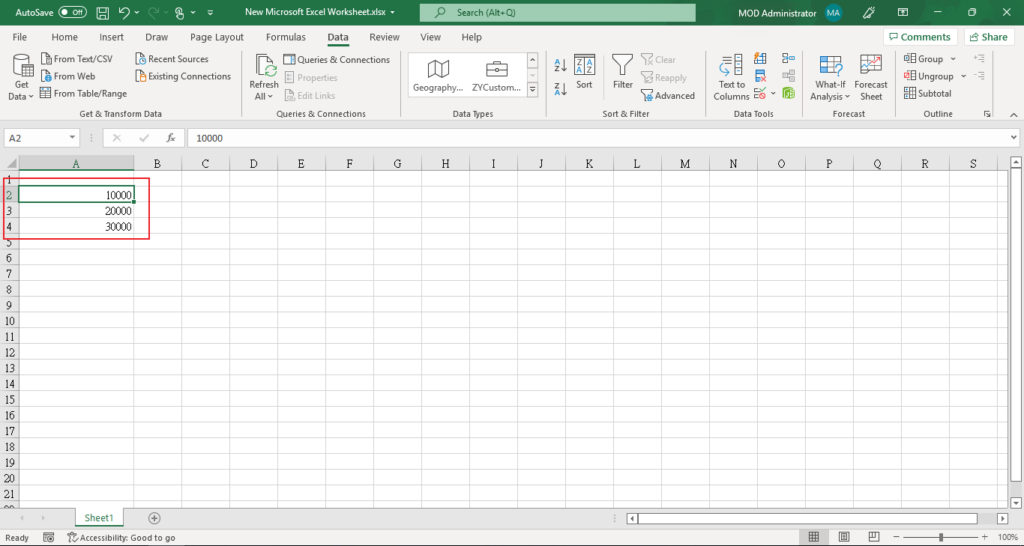
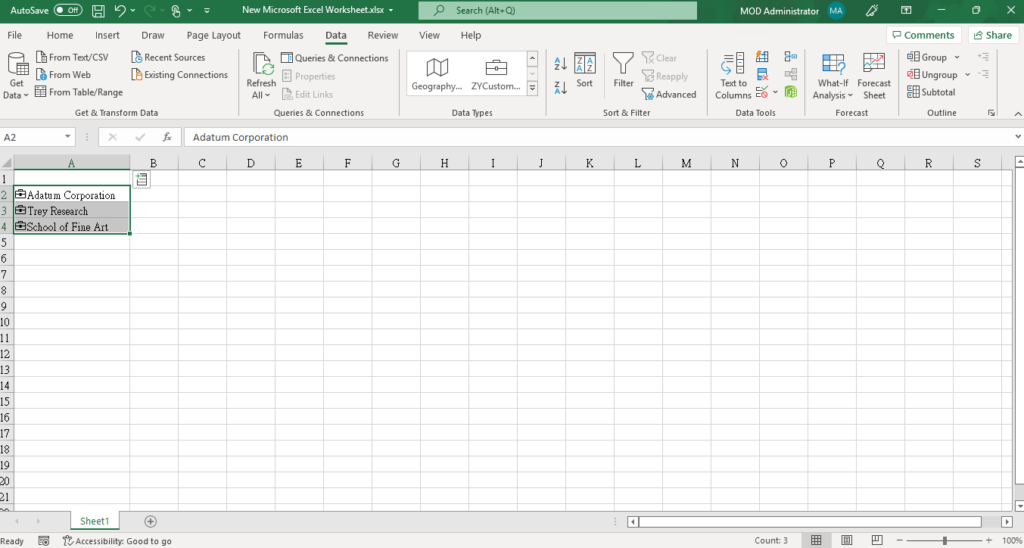
First we have to enter some data, which you can consider as key.
For example, customer number.
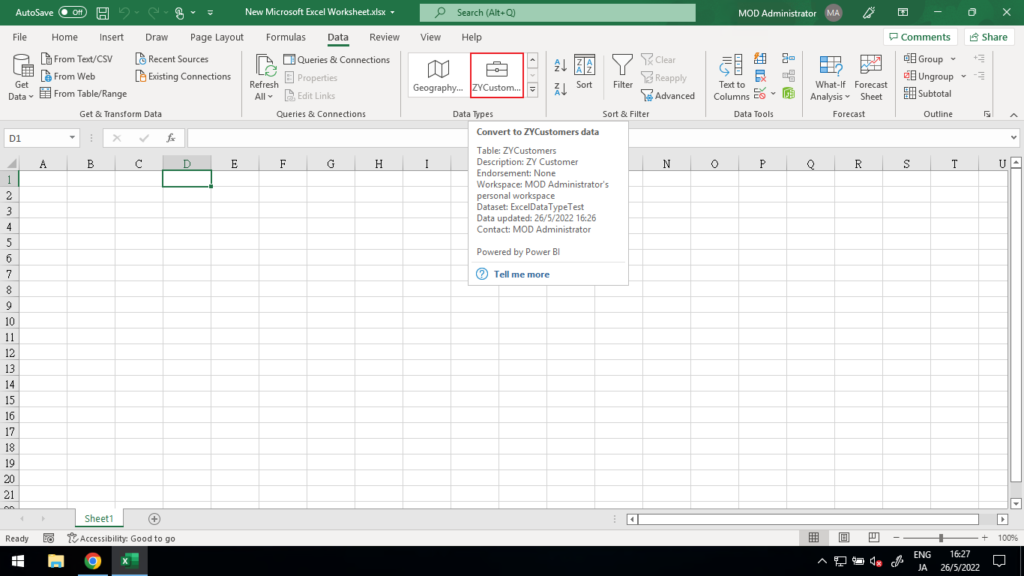
Then select the data (Cells) and click on the Data Types just created.
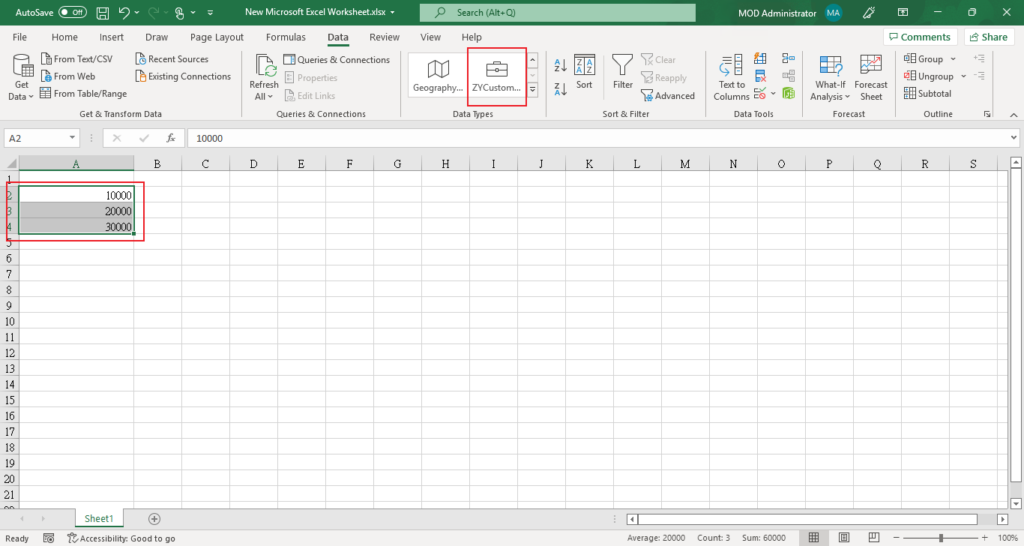
The data will be turned into the Name (Label) as defined in Power BI Desktop.
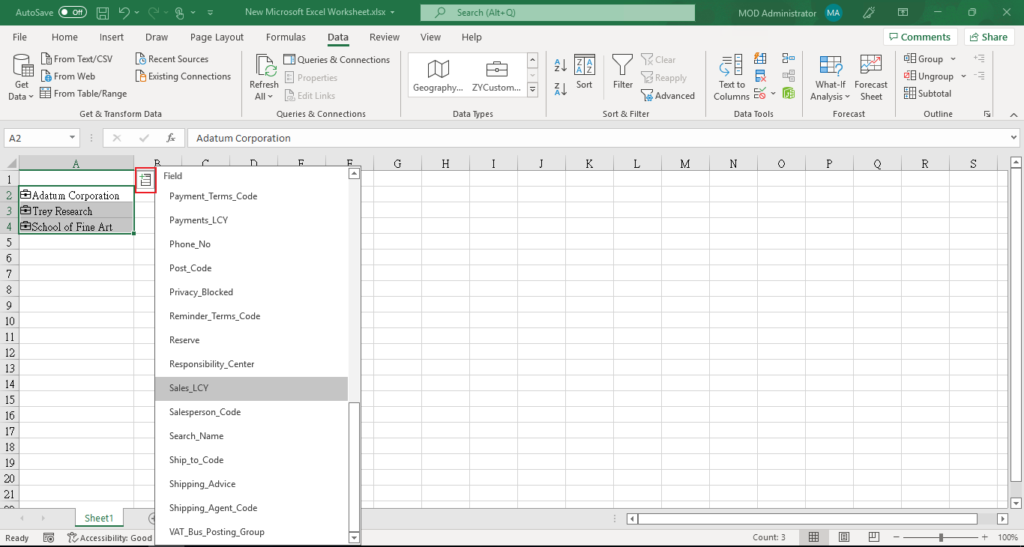
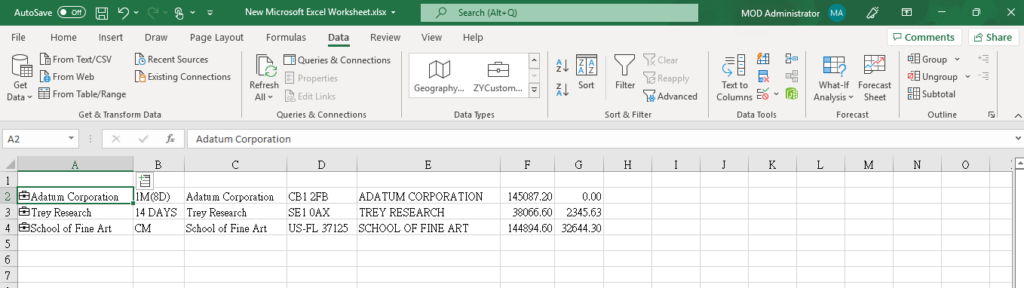
Then we can add fields in the table.
Test Video:
PS:
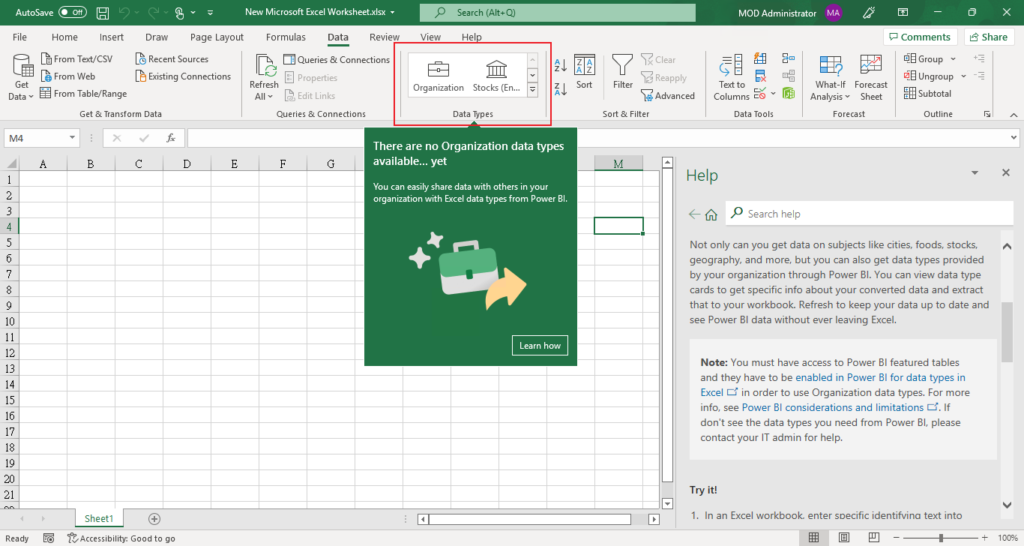
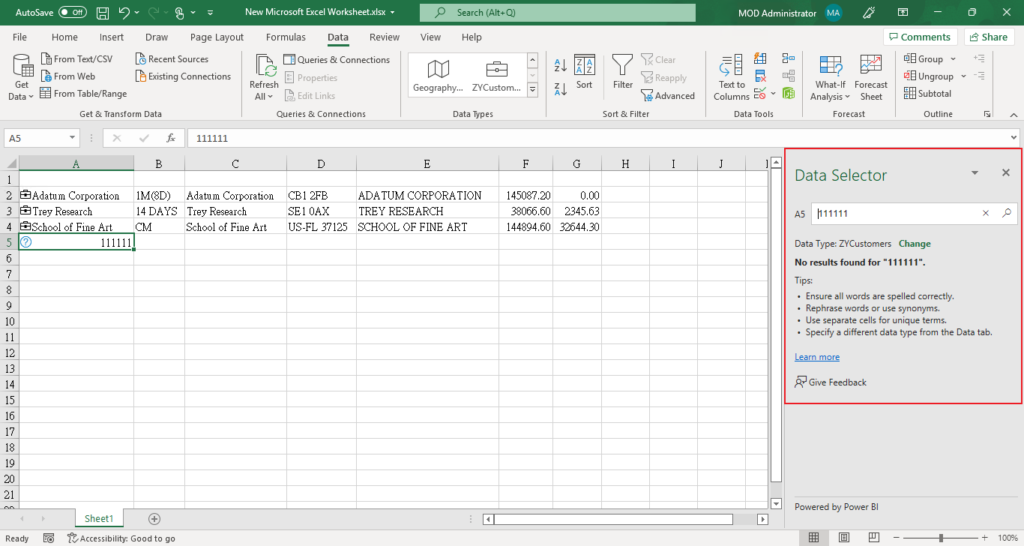
1. When the data cannot be found, there will be a prompt window on the right.
2. Considerations and limitations
Here are the current limitations:
- The integration is available in Excel in the current channel.
- Featured tables in Power BI datasets that use the following capabilities aren’t shown in Excel:
- DirectQuery datasets.
- Datasets with a live connection.
- Excel shows only data in columns, calculated columns, and measures defined in the featured table. The following aren’t provided:
- Measures defined on related tables.
- Implicit measures calculated from relationships.
- Excel only displays featured tables (data types) that are stored in the new Power BI workspaces. Featured tables stored in the classic workspaces aren’t shown as data types in Excel. You can upgrade classic workspaces to the new workspaces in Power BI.
The Data Types experience in Excel is similar to a lookup function. It takes a cell value provided by the Excel sheet, and searches for matching rows in Power BI featured tables. The search experience has the following behaviors:
- Row matching is based on text columns in the featured table. It uses the same indexing as Power BI Q&A capability, which is optimized for English-language search. Searching in other languages may not result in accurate matches.
- Featured tables use Power BI Q&A indexing when users query data in those tables. See How does indexing work with Q&A? for details.
- Most numerical columns aren’t considered for matching. If the Row Label or Key Column are numeric, they are included for matching.
- Matching is based on Exact and Prefix matches for individual search terms. A cell’s value is split based on spaces or other whitespace characters like tabs. Then each word is considered a search term. A row’s text field values are compared to each search term for Exact and Prefix matches. A Prefix match is returned if the row’s text field starts with the search term. For example, if a cell contains “Orange County”, then “Orange” and “County” are distinct search terms.
- Rows with text columns whose values exactly match “Orange” or “County” are returned.
- Rows with text columns whose values start with “Orange” or “County” are returned.
- Importantly, rows that contain “Orange” or “County” but don’t start with them aren’t returned.
- Power BI returns at most 100 row suggestions for each cell.
- Some symbols aren’t supported.
- Setting or updating the featured table isn’t supported in the XMLA endpoint
- Excel files with a data model can be used to publish featured tables. Load the data into Power BI Desktop and then publish the featured table.
- Changing the Table name, Row Label, or Key Column in the featured table may impact Excel users with linked cells to rows in the table.
- Excel shows when the data was retrieved from the Power BI dataset. This time isn’t necessarily the time that the data was refreshed in Power BI, or the time of the most recent data point in a dataset. For example, say a dataset in Power BI was refreshed a week ago, but the underlying source data was a week old when the refresh happened. The actual data would be two weeks old, but Excel would show data retrieved as the date/time at which the data was pulled into Excel.
- See Considerations and limitations in the article “Access Power BI featured tables in Excel” for other Excel considerations.
3. Find more about Excel Data Types in MS Docs:
Introducing Excel Organization data types from Power BI
Set featured tables in Power BI Desktop to show in Excel Organization Data Types Gallery
Convert text to an Organization data type
END
Hope this will help.
Thanks.
ZHU
コメント