Hi, Readers.
Today I would like to share another mini tip about Business Central, how to quickly create a Comparing Years report (Year-Over-Year or YoY Analysis) in Analysis Mode.
Comparing Years report (Year-Over-Year or YoY Analysis) simply means comparing year-over-year or year-on-year data. It is a method to evaluate and compare different metrics over a specific time period with the same time period in the previous year or years. For example, 2025 is compared with 2024 and 2023 data.
It’s common to see clients making these kinds of requests, and some consultants might suggest customization. Actually, it’s quite easy to do using Analysis Mode, and I’ll share a simple method in this post.
“Analysis mode” is a feature that allows users to interact with data on lists in a way that’s optimized for data analysis, enabling them to create detailed pivot tables, reports, and analysis views directly from the same page, without needing to run separate reports or switch to other applications. It was introduced as a public preview feature in 2023 release wave 1 (BC22), and provided a new way to interact with data on list pages. More details: Analyze, group, and pivot data on list pages using multiple tabs (In-client Analysis mode)
Since then, Microsoft has continued to update this feature.
- Business Central 2023 wave 2 (BC23): Analyze, group, and pivot data on queries using multiple tabs (In-client Analysis mode in Query)
- Business Central 2023 wave 2 (BC23): Turn off data analysis mode on pages and queries (AnalysisModeEnabled Property and Allow Data Analysis Mode permission)
- Business Central 2023 wave 2 (BC23.1): The AnalysisModeEnabled property is now supported on pages of type Worksheet
- Business Central 2023 wave 2 (BC23): Share a data analysis with a co-worker (Copy link in the Analysis mode)
- Business Central 2024 wave 1 (BC24): Get to insights fast with Copilot-created analysis tabs (Analysis mode)
- Business Central 2024 wave 2 (BC25): Experience enhancements to analysis assist with Copilot
- Business Central 2025 wave 1 (BC26.2): Add fields/columns from related tables in analysis mode (No customization)
Let’s see more details. I’ll use General Ledger Entries as an example this time.
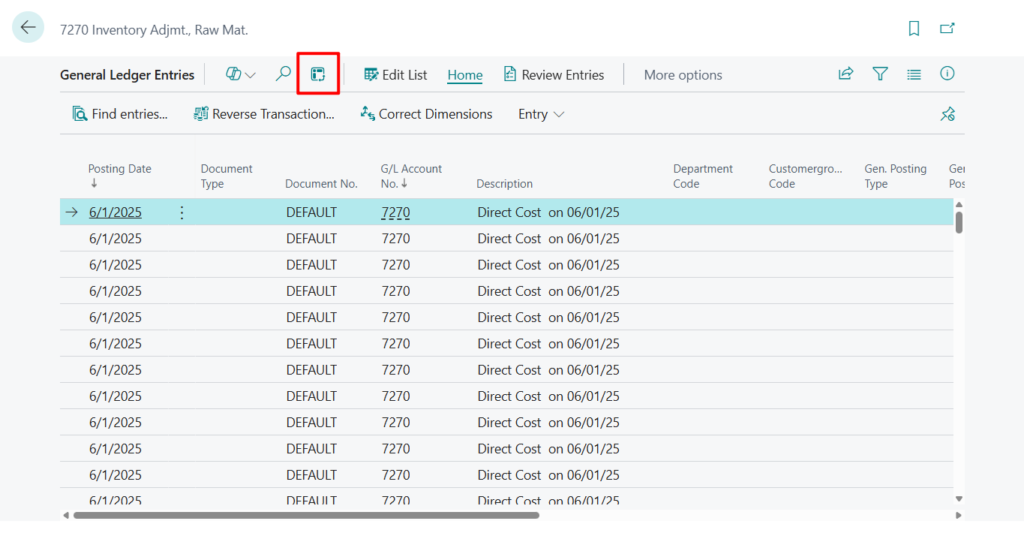
First, click the analysis mode icon to enter analysis mode.
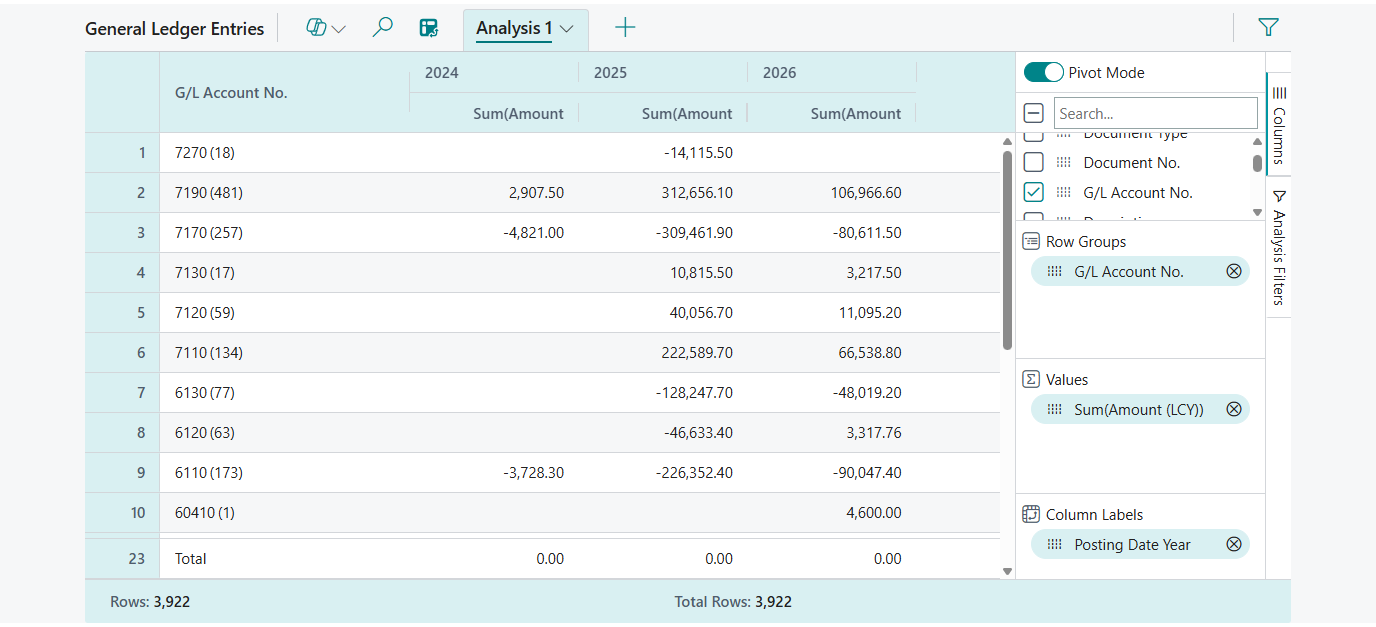
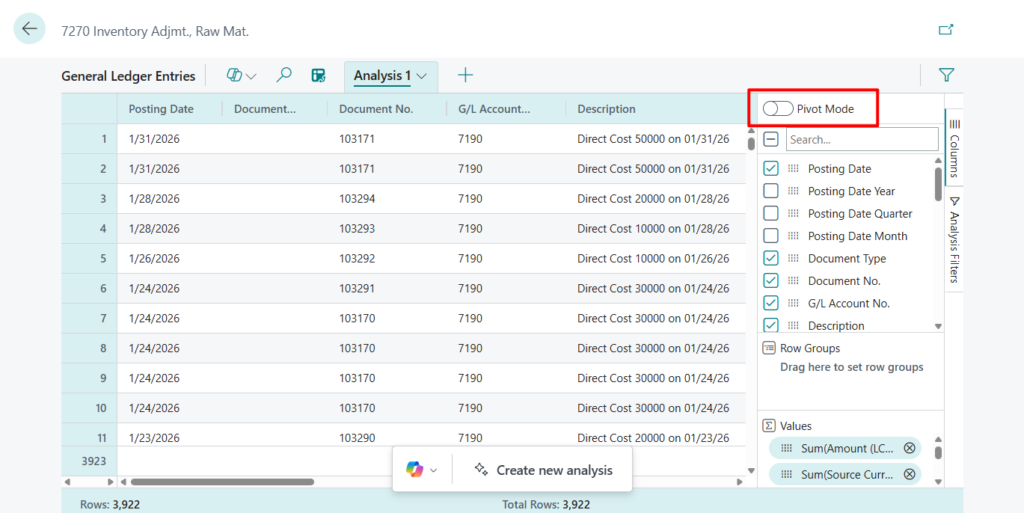
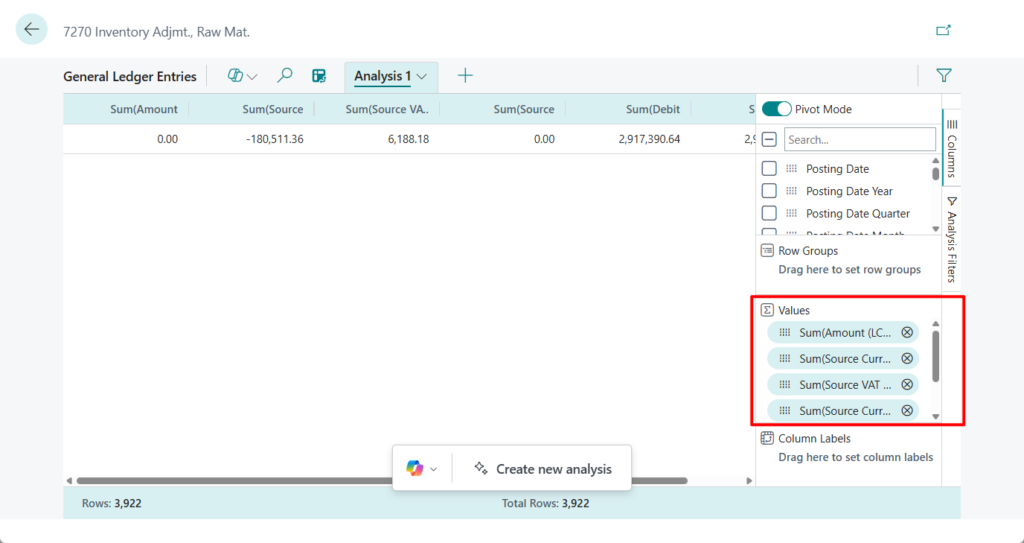
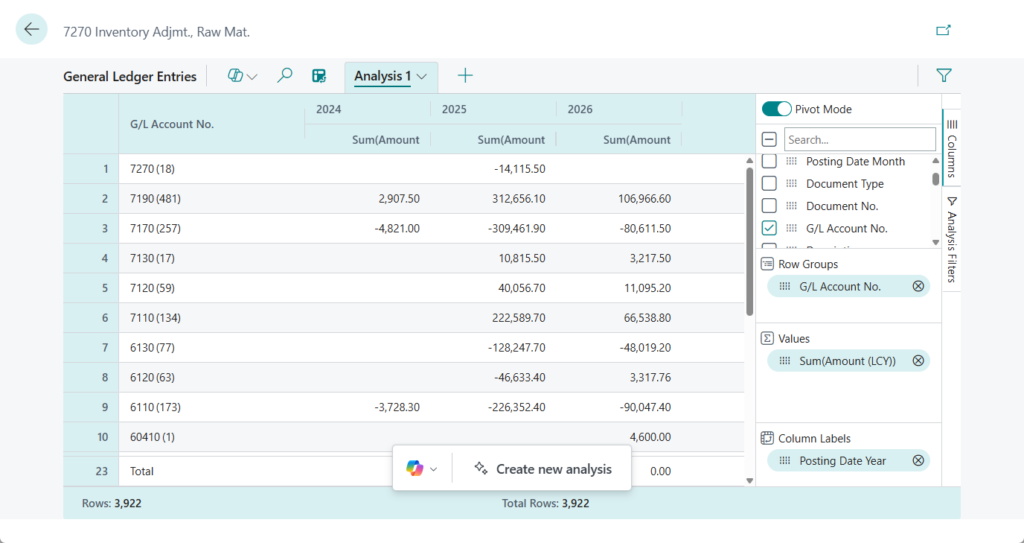
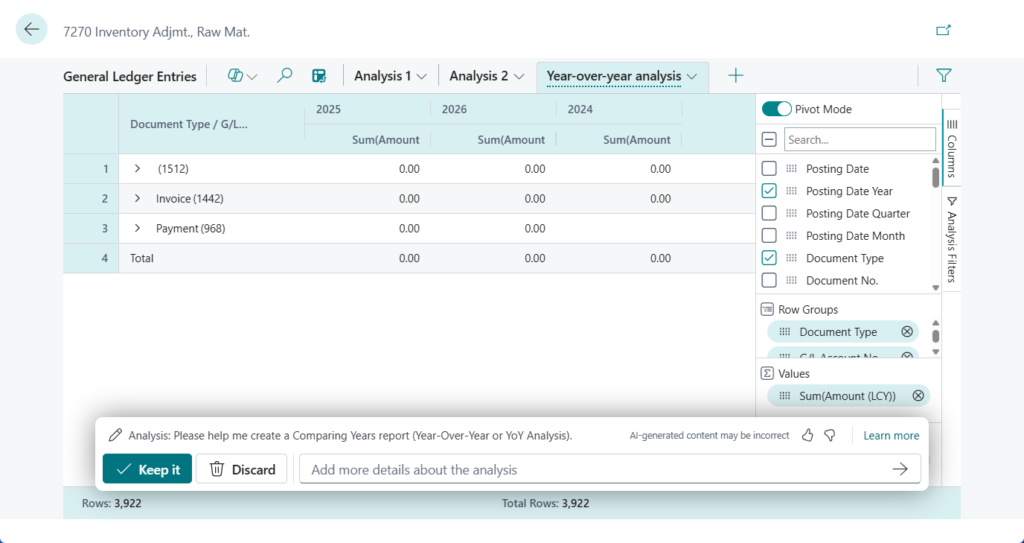
1. Turn on the Pivot Mode toggle
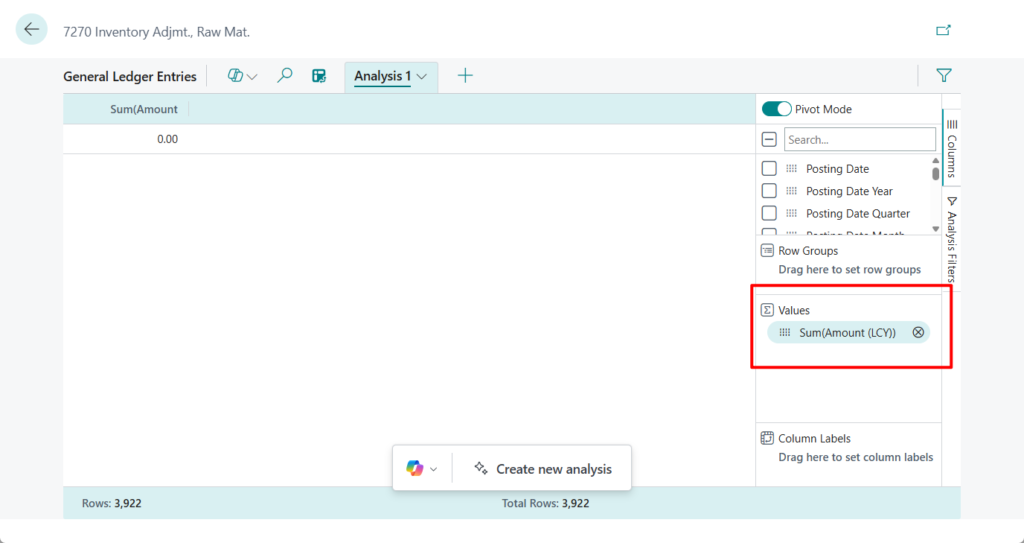
2. Set the values you want to display.
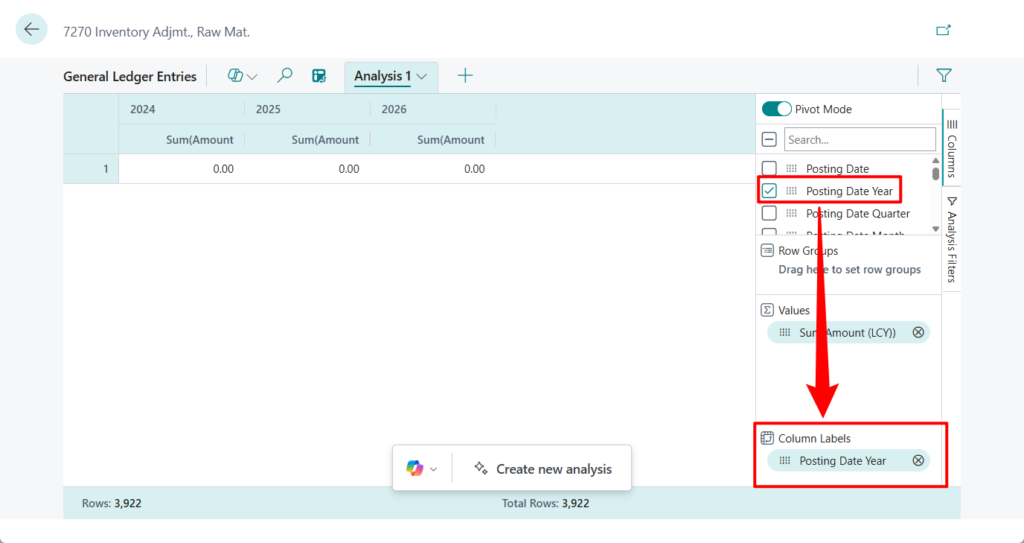
3. Drag the Posting Date Year into the Column Labels.
4. Set the row group, such as displaying the G/L Account No.
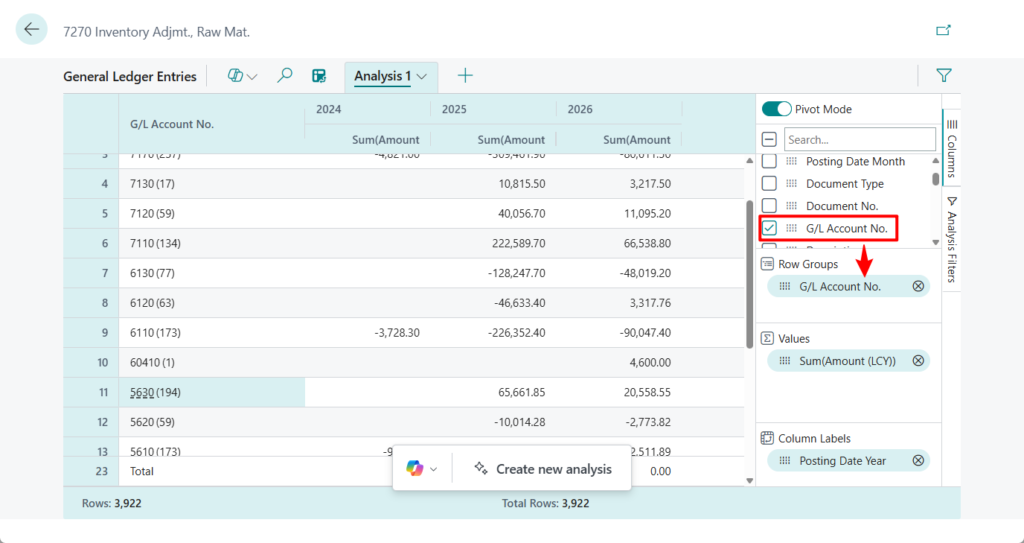
Done.
More details: Pivot mode
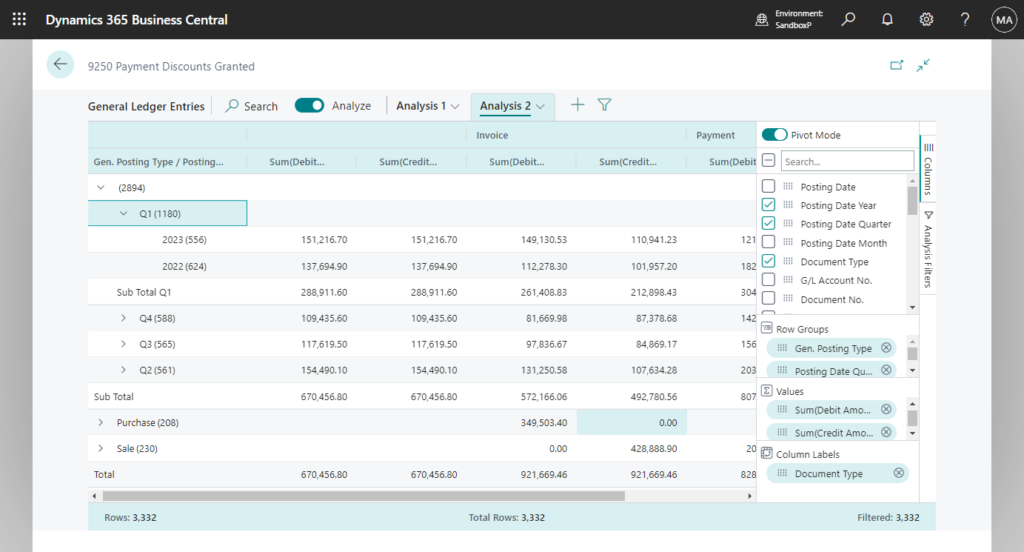
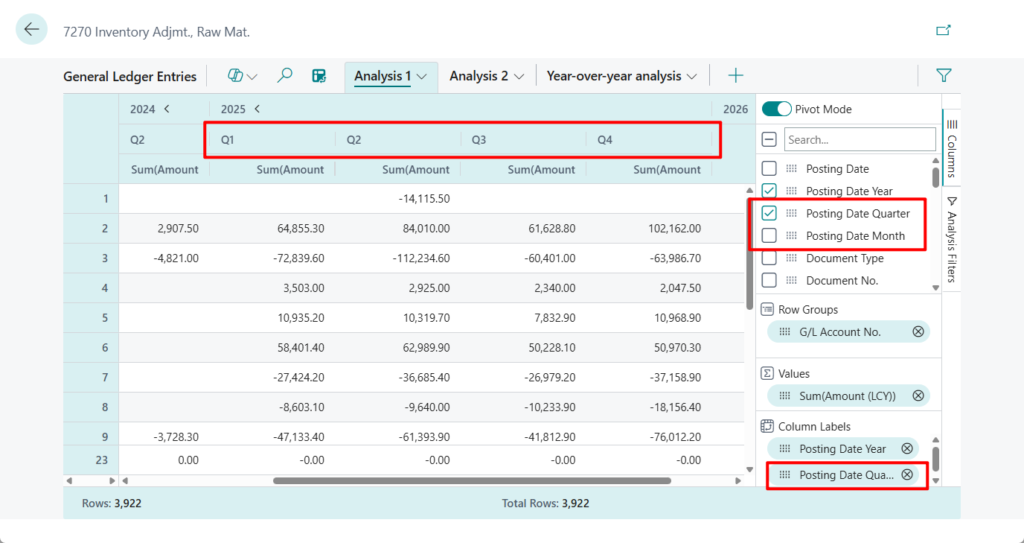
You can further refine your analysis by drilling down into Quarter or Month levels as needed.
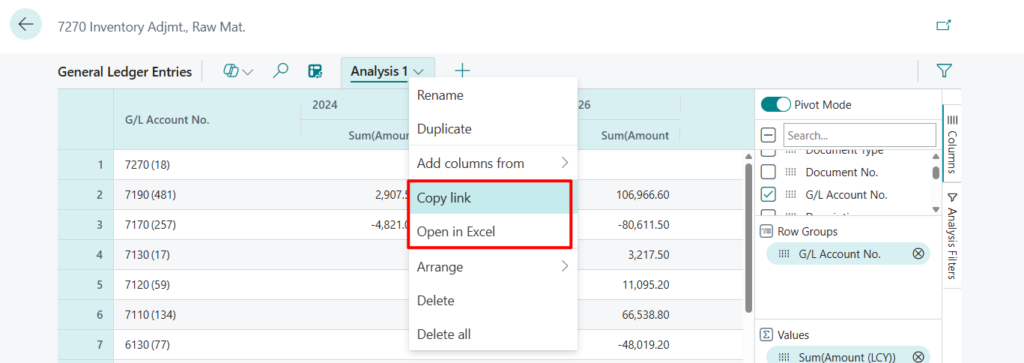
You can then use Copy Link to share it with other users, or use Open in Excel to export it as an Excel file.
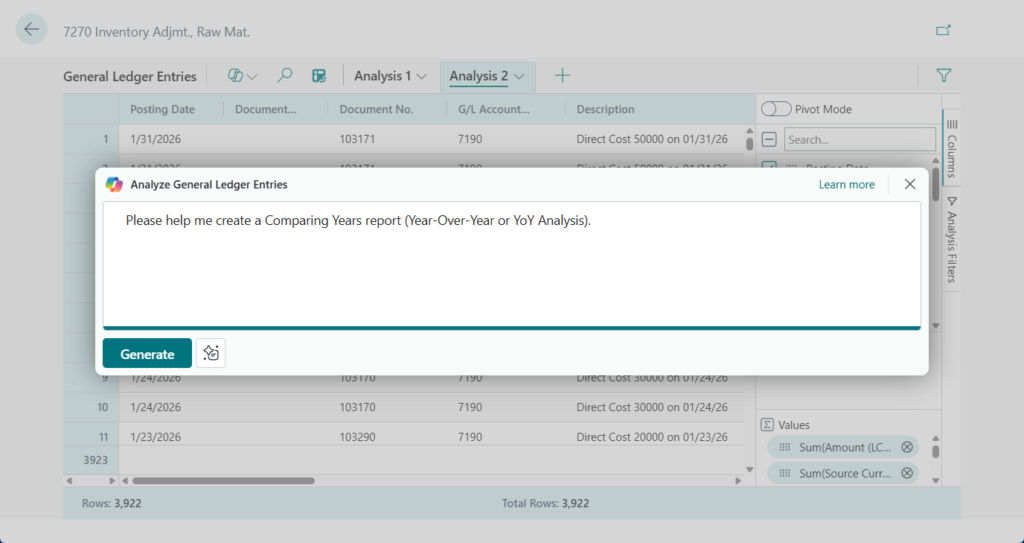
PS: You can also use Copilot to help you create reports.
More details:
- Business Central 2024 wave 1 (BC24): Get to insights fast with Copilot-created analysis tabs (Analysis mode)
- Business Central 2024 wave 2 (BC25): Experience enhancements to analysis assist with Copilot
Great. Give it a try!!!😁
END
Hope this will help.
Thanks for reading.
ZHU

コメント