
Hi, Readers.
The public preview for Dynamics 365 Business Central 2025 release wave 2 (BC27) is available. Learn more: Link.
I will continue to test and share some new features that I hope will be helpful. In this post, I would like to talk about View SQL call information in performance profiles.
View SQL call information in performance profiles:
Business value:
Understanding SQL performance when troubleshooting in the cloud without direct SQL access can be hard. Now you have the capability to track SQL calls, both when using the in-client profiler in the web client as well as when capturing snapshots from Visual Studio Code. This will help consultants and developers to faster identify and troubleshoot SQL issues in customer production environments, providing a better customer experience.
https://learn.microsoft.com/en-us/dynamics365/release-plan/2025wave2/smb/dynamics365-business-central/view-sql-call-information-performance-profiles?wt.mc_id=DX-MVP-5004336
In Business Central 2021 wave 2 (BC19), Micorosft added the AL performance profiler to the Visual Studio Code AL experience. This feature is mainly for developers. The performance profiler has empowered pro developers to investigate performance as part of developing new functionality.
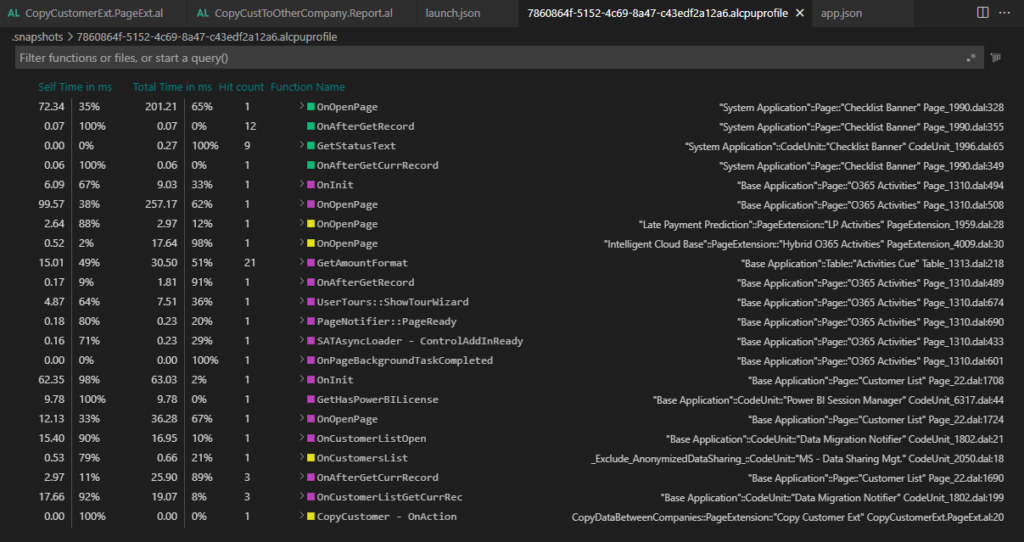
More details: Profiling AL performance with snapshot debugger (AL: Generate profile file)
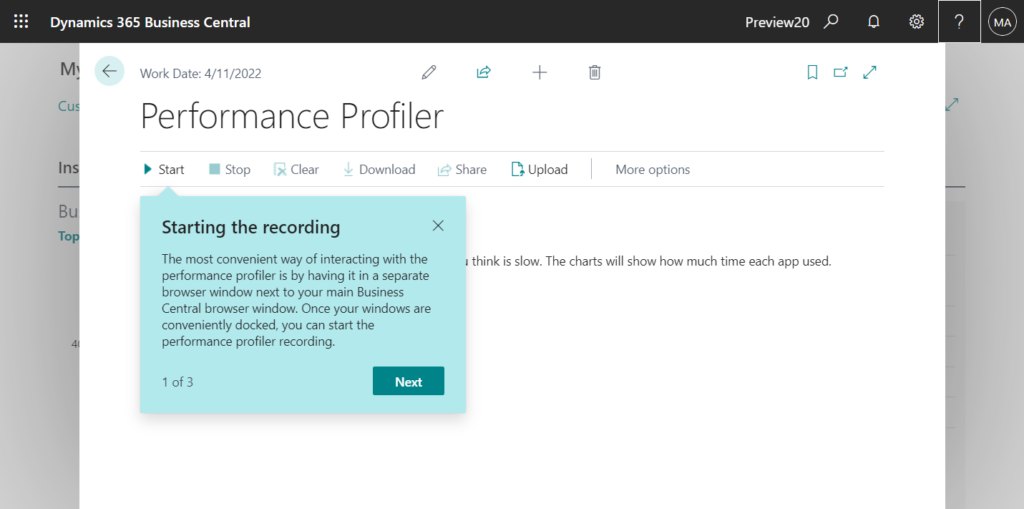
In Business Central 2022 wave 1 (BC20), Microsoft are going to take this even further. The in-client performance profiler feature is available. Any user with permission can analyze performance issues in Business Central.
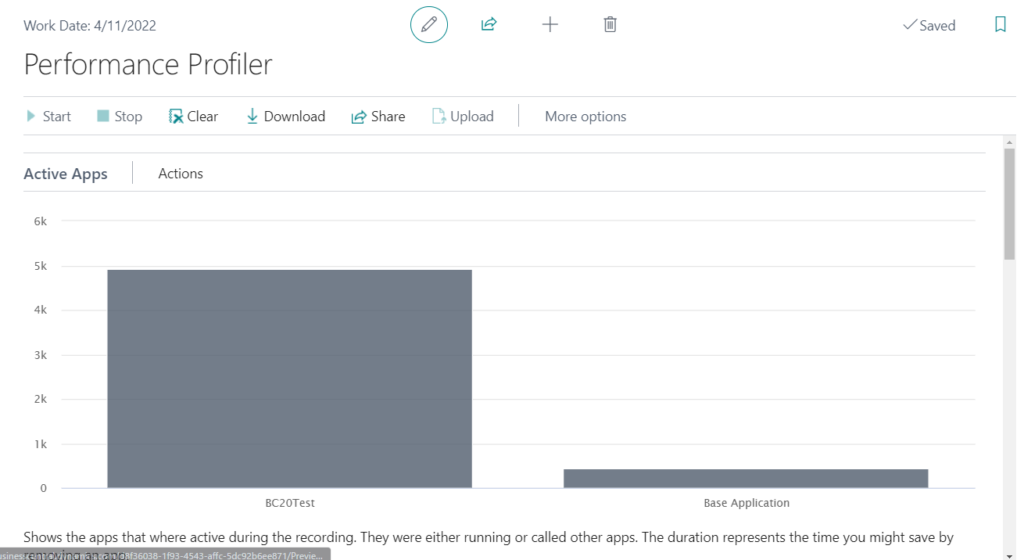
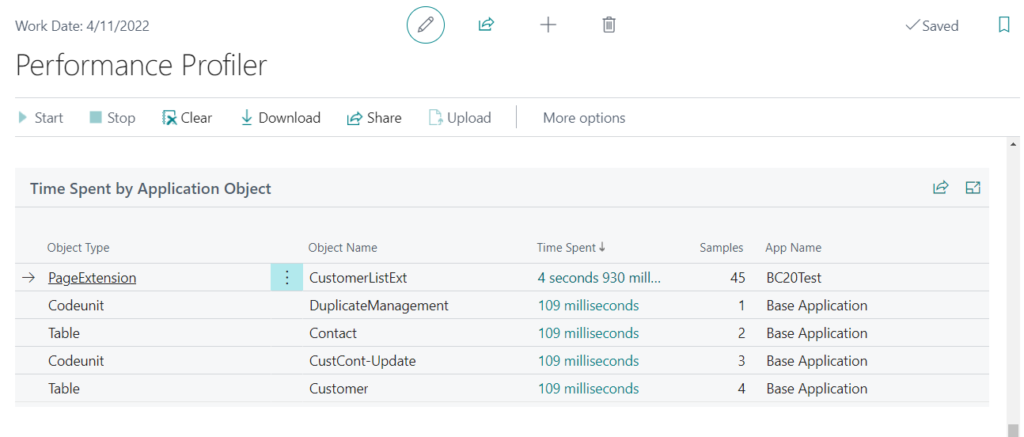
Active Apps: Shows the apps that where active during the recording. They were either running or called other apps. The duration represents the time you might save by removing an app.
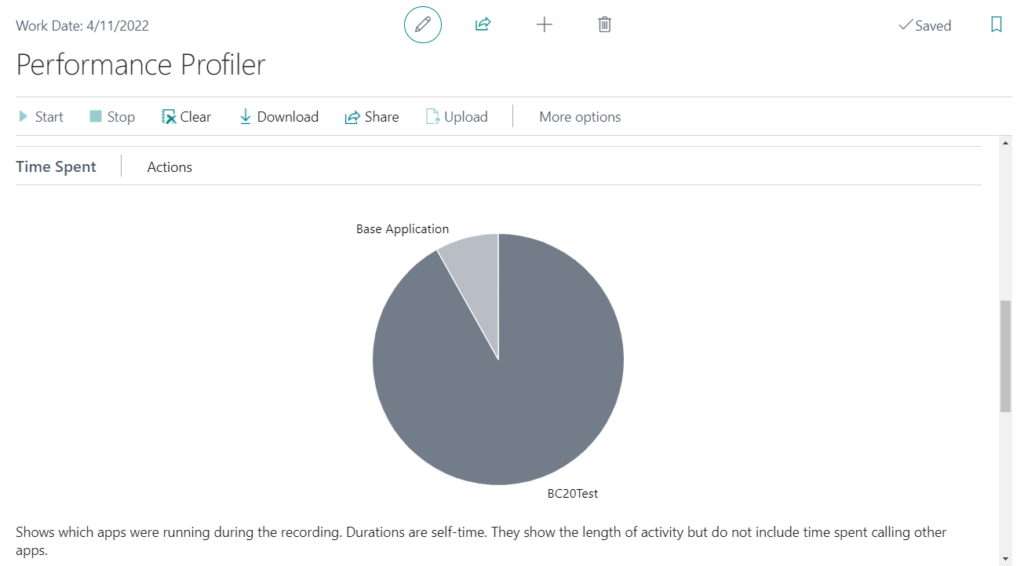
Time Spent: Shows which apps were running during the recording. Durations are self-time. They show the length of activity but do not include time spent calling other apps.
Time Spent by Application Object:
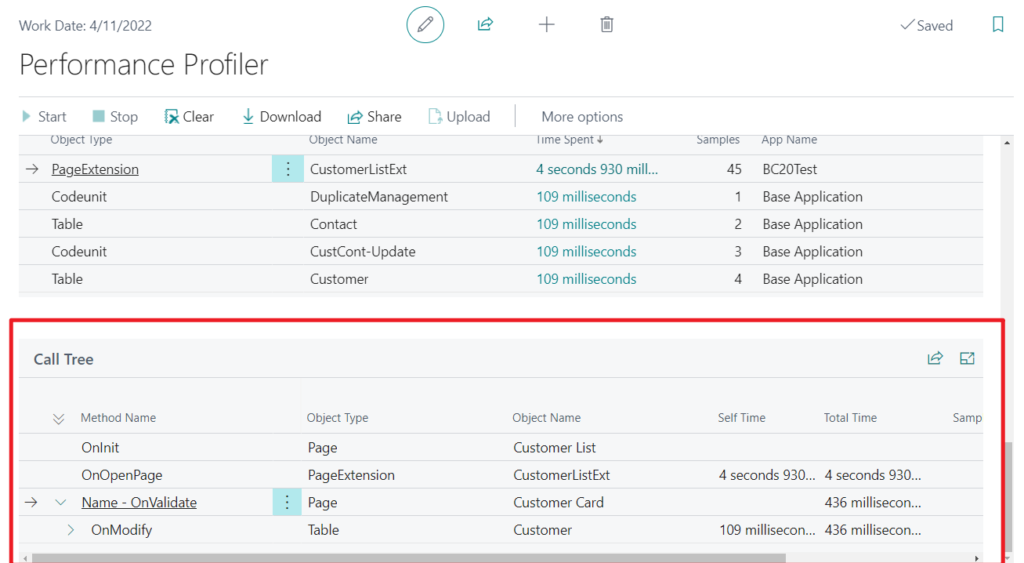
Call Tree:
Test Video:
More details: Business Central 2022 wave 1 (BC20) new features: In-client performance profiler (Performance Profiler page)
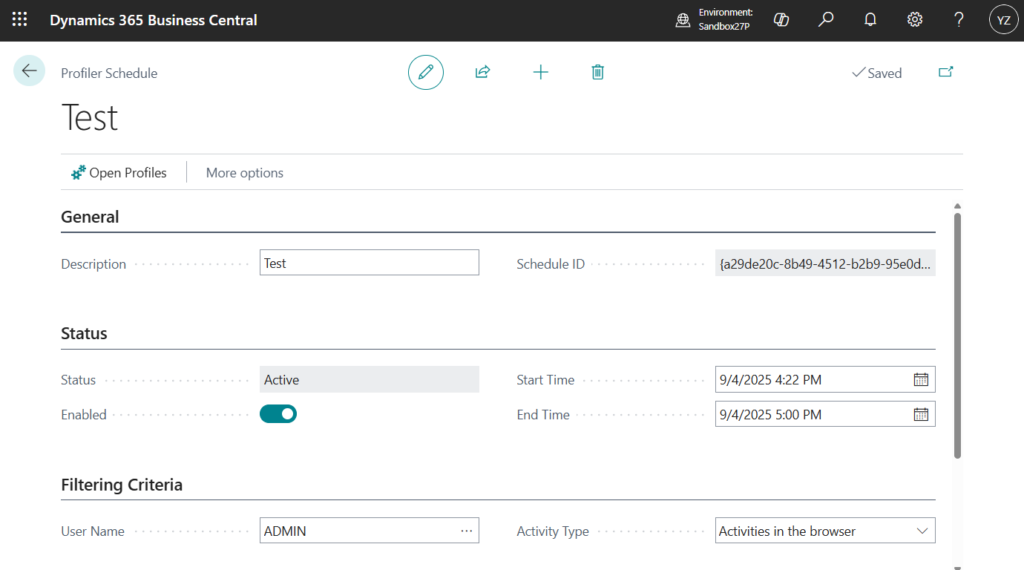
And in Business Central 2024 wave 2 (BC25), in addition to the existing interactive way of capturing a performance profile – by starting the profile, performing repro steps in the client, stopping the profiler and then analyzing the results – a new rule-based scheduling mode for capturing profiles in the background is added.
Profiler Schedule:
Performance Profiles:

More details: Business Central 2024 wave 2 (BC25): Set up easier in-client performance profiling with rules (Profiler Schedules)
With this wave (BC27), Microsoft has enhanced this feature again. You can now see which calls are made to SQL during a performance profile, and therefore better assess whether bad performance is due to AL code inefficiencies or resulting SQL calls.

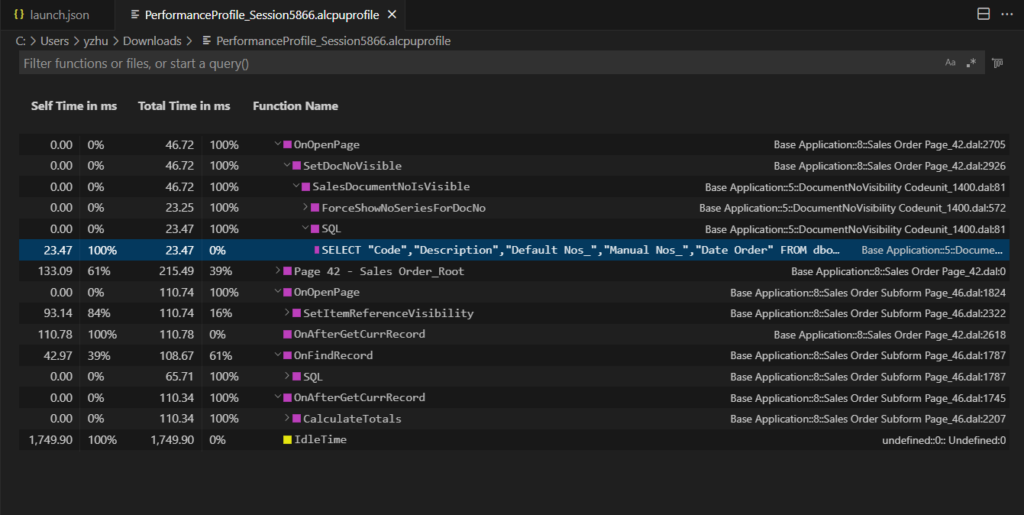
When drilling into a specific profile, you can see the actual SQL calls that are made. You can hover over them and copy the queries.
SELECT "Document Type","No_","Sell-to Customer No_","Bill-to Customer No_","Bill-to Name","Bill-to Name 2","Bill-to Address","Bill-to Address 2","Bill-to City","Bill-to Contact","Your Reference","Ship-to Code","Ship-to Name","Ship-to Name 2","Ship-to Address","Ship-to Address 2","Ship-to City","Ship-to Contact","Order Date","Posting Date","Shipment Date","Posting Description","Payment Terms Code","Due Date","Payment Discount _","Pmt_ Discount Date","Shipment Method Code","Location Code","Shortcut Dimension 1 Code","Shortcut Dimension 2 Code","Customer Posting Group","Currency Code","Currency Factor","Customer Price Group","Prices Including VAT","Invoice Disc_ Code","Customer Disc_ Group","Language Code","Format Region","Salesperson Code","Order Class","No_ Printed","On Hold","Applies-to Doc_ Type","Applies-to Doc_ No_","Bal_ Account No_","Ship","Invoice","Print Posted Documents","Shipping No_","Posting No_","Last Shipping No_","Last Posting N...WHERE ("Document Type"=@0 AND "No_"=@1) OPTION(OPTIMIZE FOR UNKNO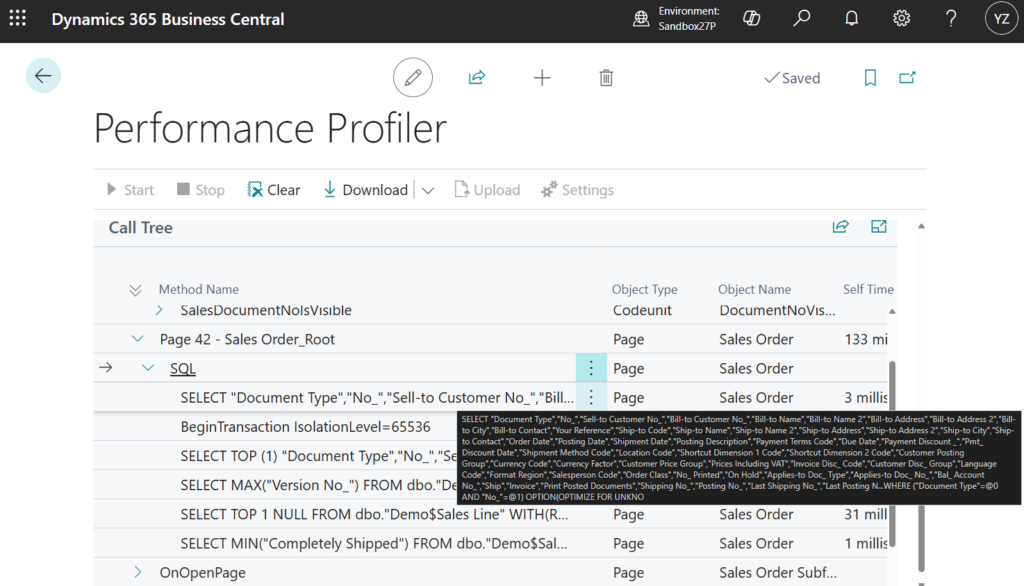
This can also be confirmed in VS Code.
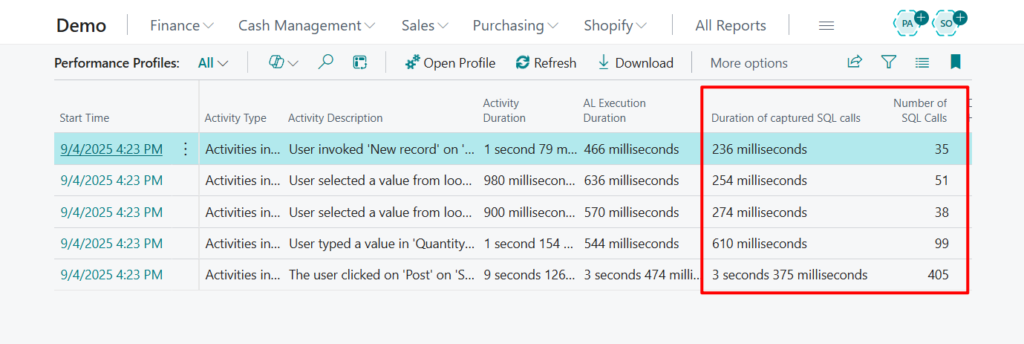
For scheduled profiles, in the Performance Profiles overview page you can see the total duration of captured SQL calls in partner code, number of calls, and the duration of platform calls.
Duration of captured SQL calls
Specifies the duration of SQL calls during the activity that was profiled in milliseconds.
Number of SQL Calls
Specifies the number of SQL calls during the activity that was profiled in milliseconds.
Great, give it a try!!!😁
PS:
1. View SQL locks during AL debugging (Locks in Database Statistics)
END
Hope this will help.
Thanks for reading.
ZHU


コメント