Hi, Readers.
Minor update 22.1 for Business Central 2023 release wave 1 has just been released. Learn more: Link.
I will continue to test and share some new features that I hope will be helpful.
This feature is mentioned in What’s new and planned for update 22.1 for Microsoft Dynamics 365 Business Central 2023 release wave 1.
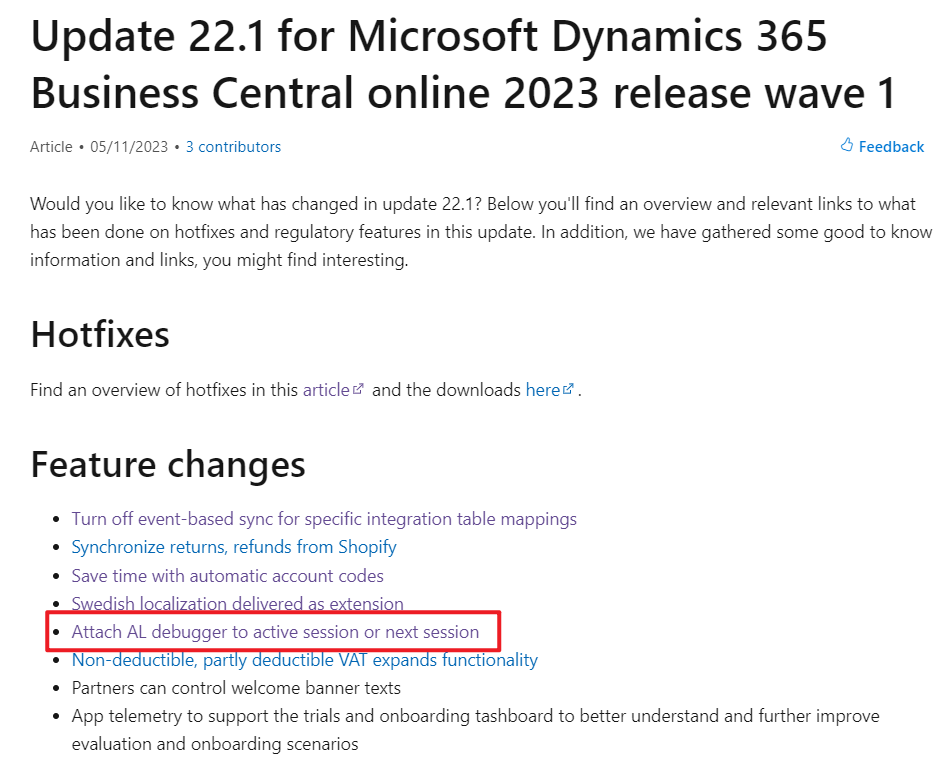
Attach AL debugger to active session or next session:
Business value:
https://learn.microsoft.com/en-us/dynamics365/release-plan/2023wave1/smb/dynamics365-business-central/attach-al-debugger-active-session-or-next-session-specific-user
The legacy C/AL debugger supported attaching to an existing session or to the next session for a specific user. While this has been possible with the AL snapshot debugger for some time, the standard, more powerful AL debugger in Visual Studio Code is still missing this capability, and it’s been a partner ask to fill this gap for a while. With the introduction of service-to-service (S2S) authentication, this has become more important, since it’s now much harder to debug important web service scenarios, which are only possible with snapshot debugger.
Just as with the snapshot debugger, attach the AL debugger to either an existing running session or to the next session for the specific user. In both cases, this is set up by specifying a session ID or a user ID in the launch.json attach configuration.
More details: Snapshot Debugging (Debugging in Cloud Production)
| Setting | Description |
|---|---|
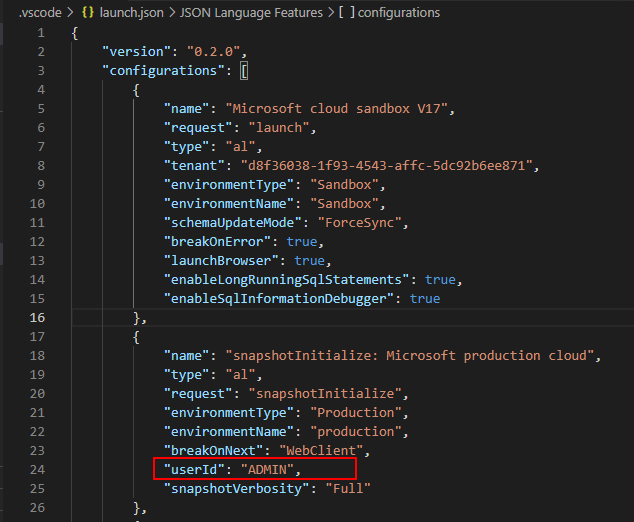
userId | The GUID of the user on whose behalf a snapshot debugging will be started. For on-premises, this can also be the user name in user password authentication scenarios. The user must be able to start, or have a session type opened that is specified in the breakOnNext parameter. For more information, see JSON Files. |
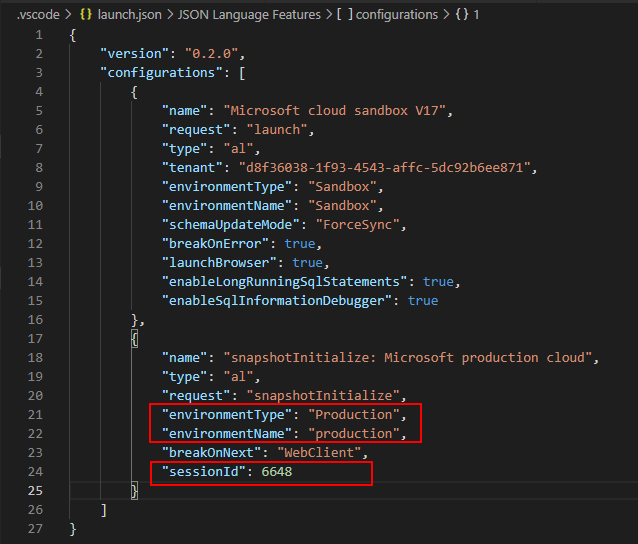
sessionId | A session ID for the user specified above in userId. |
Session ID in snapshot debugger:
User ID in snapshot debugger:
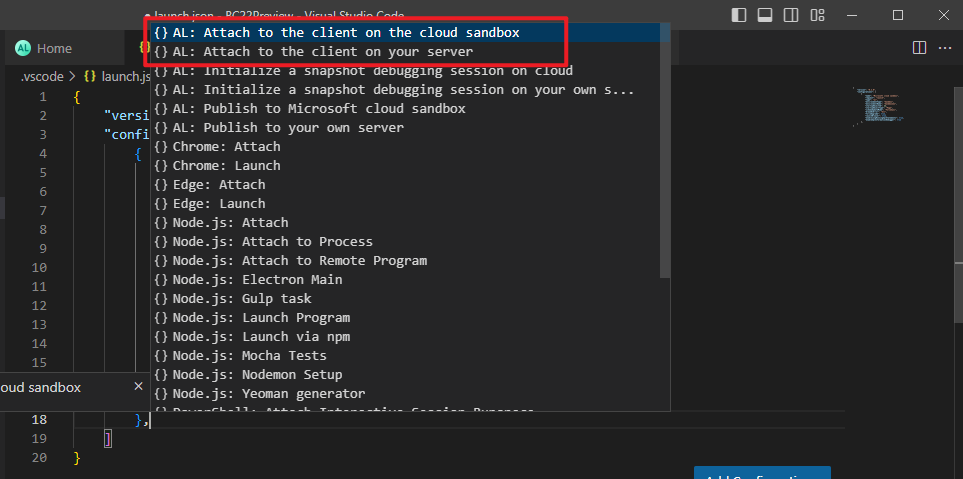
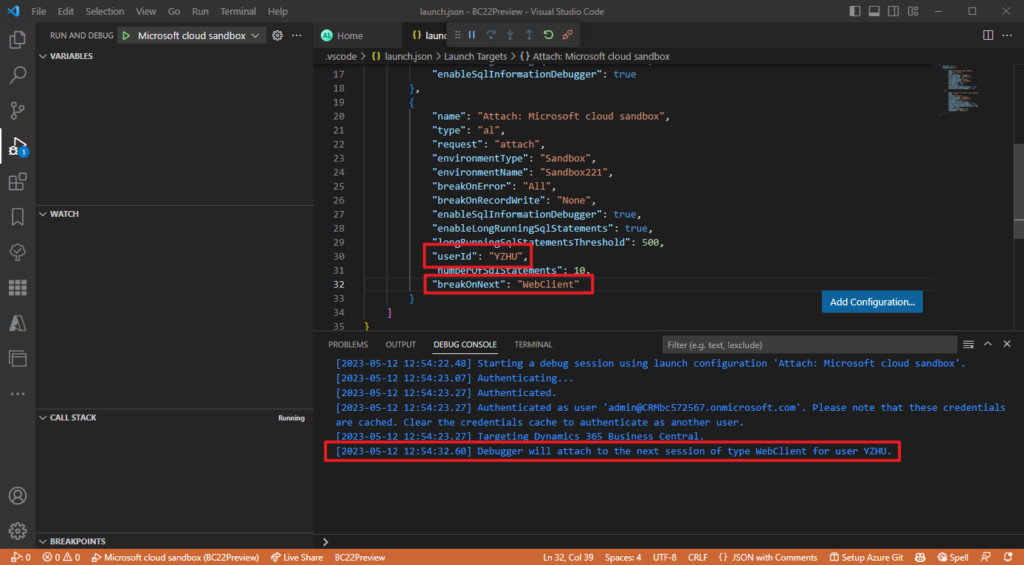
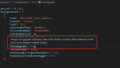
Let’s see more details. When we add new configurations in the Launch.json file, we choose AL: Attach to the client on the cloud sandbox/your server (“request”: “attach”).
Let me try “Attach: Microsoft cloud sandbox”.
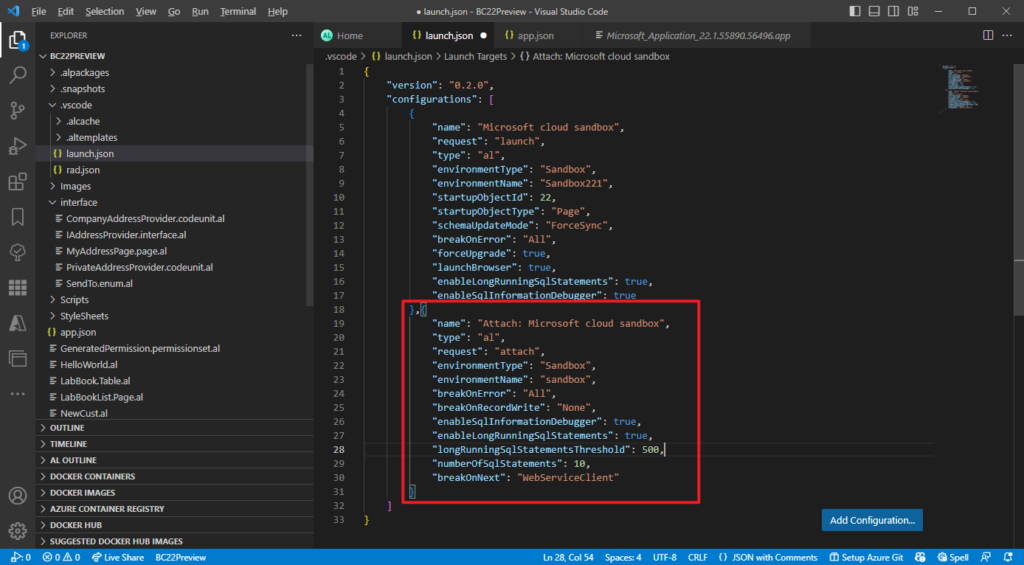
Like the snapshot debugger, we can add “userId” and “sessionId” in this configuration now.
“userId”: Specifies the end user id who will first connect to perform debugging session. It can be either a username or GUID.

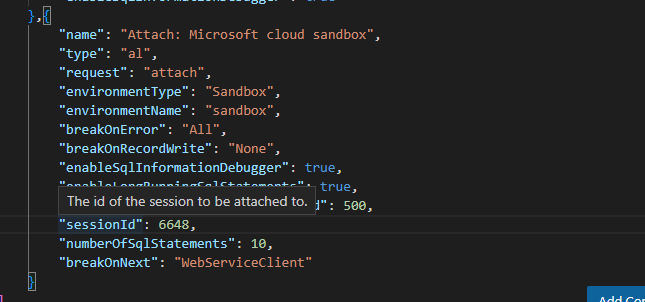
“sessionId”: The id of the session to be attached to.
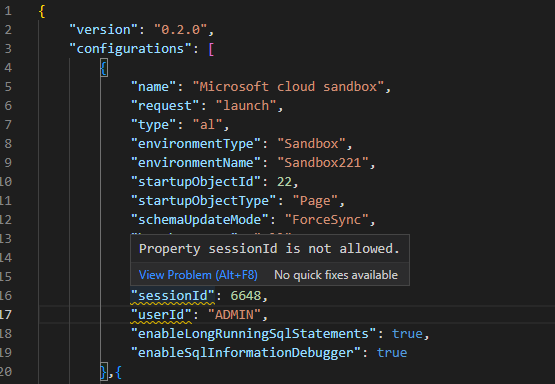
PS: For “request”: “launch”, these two settings are not allowed.
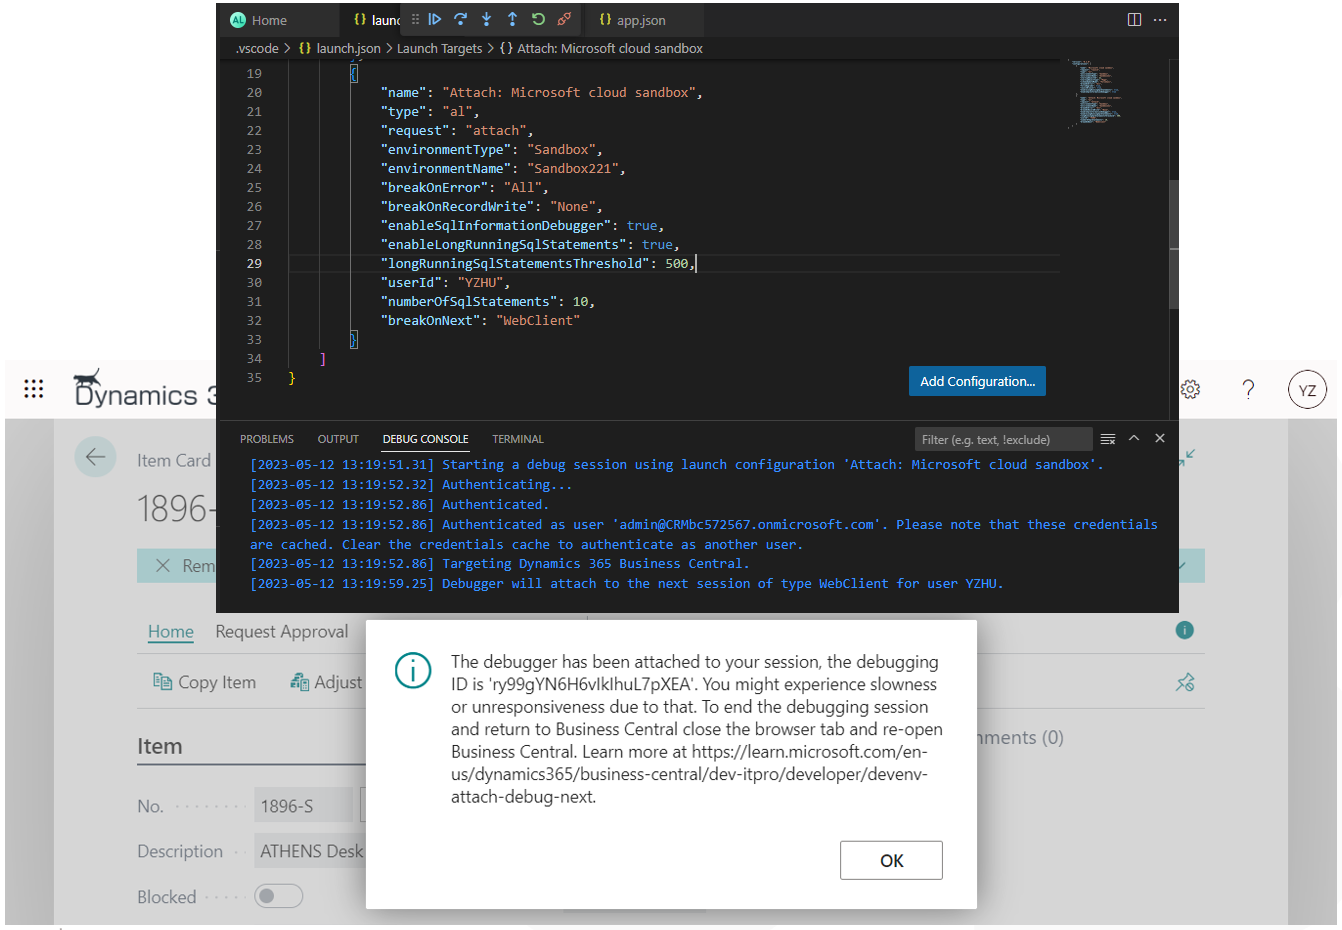
Let me continue the test. Set “userId” to “YZHU” and change “breakOnNext” to “WebClient”. Then publish.
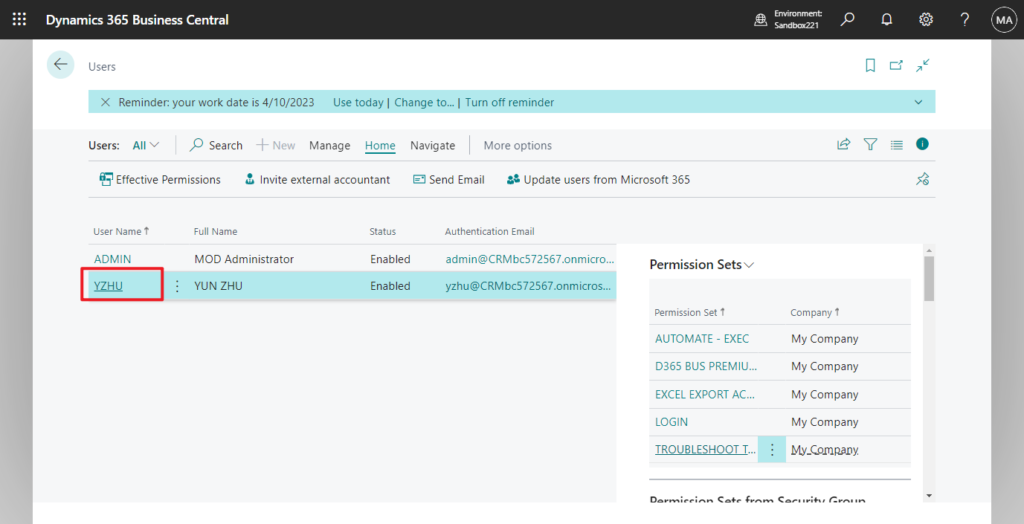
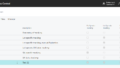
Users in BC:
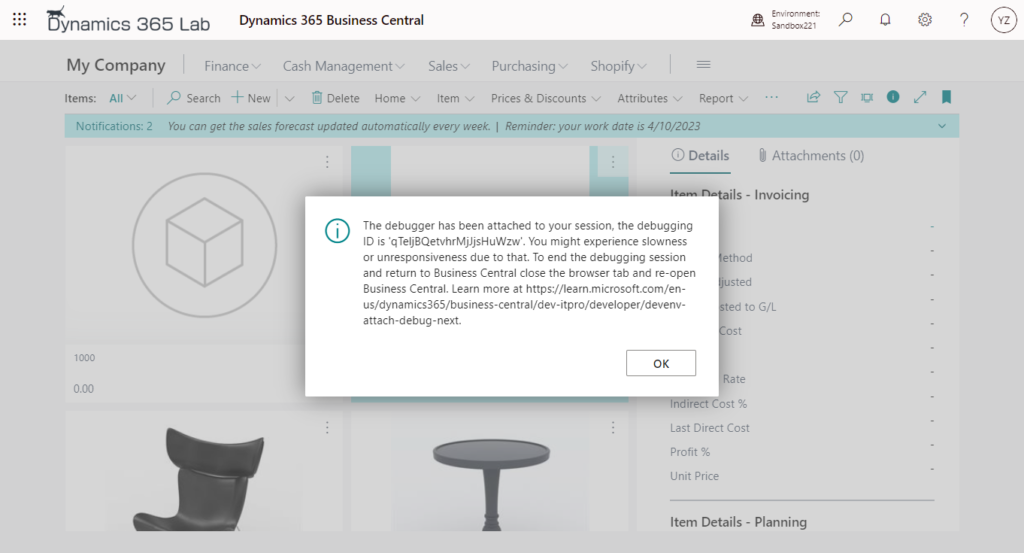
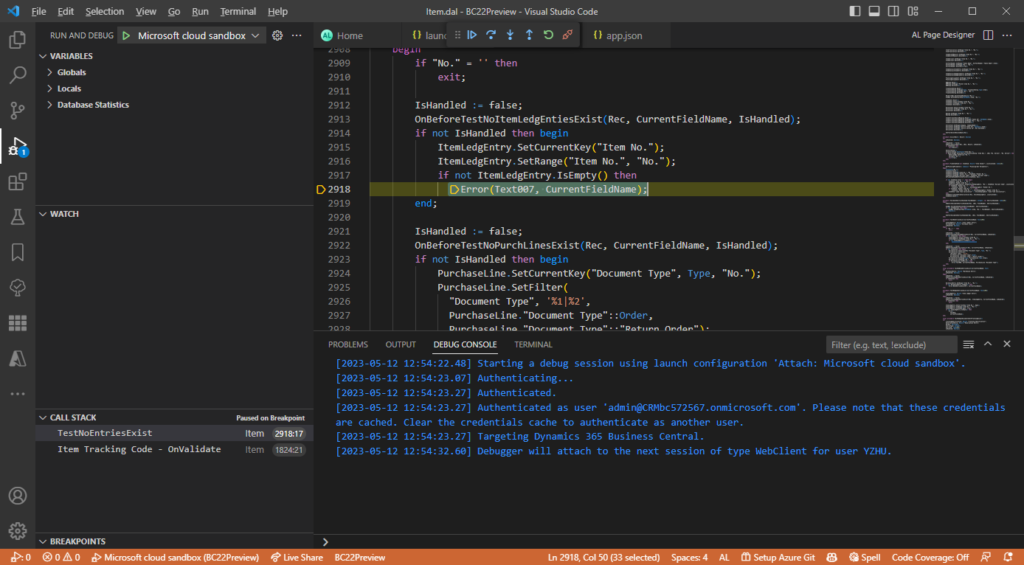
When the specified user opens BC, there will be the following warning.
The debugger has been attached to your session, the debugging ID is ‘qTeljBQetvhrMjJjsHuWzw’. You might experience slowness or unresponsiveness due to that. To end the debugging session and return to Business Central close the browser tab and re-open Business Central. Learn more at https://learn.microsoft.com/en-us/dynamics365/business-central/dev-itpro/developer/devenv-attach-debug-next.
Developers can debug when errors occur.
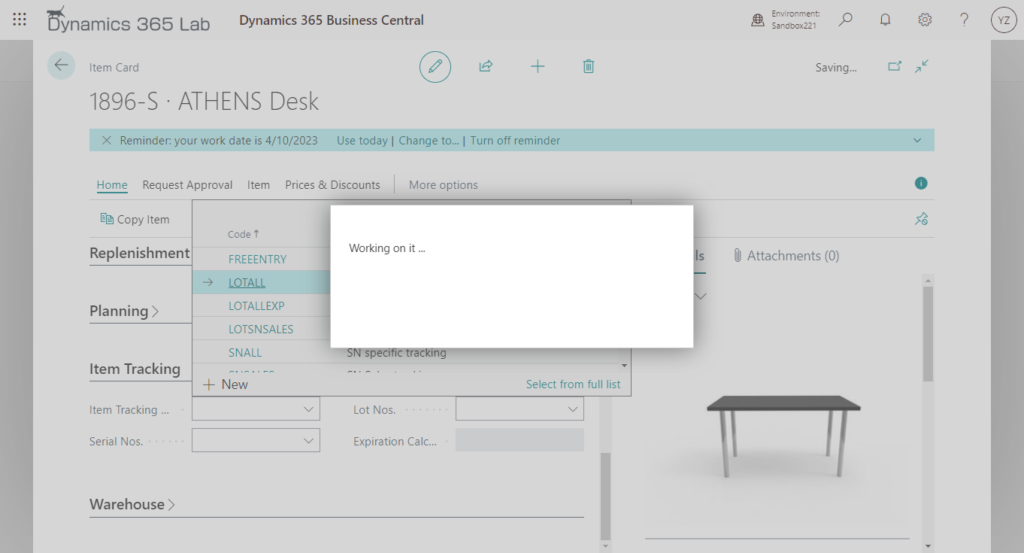
Test video:
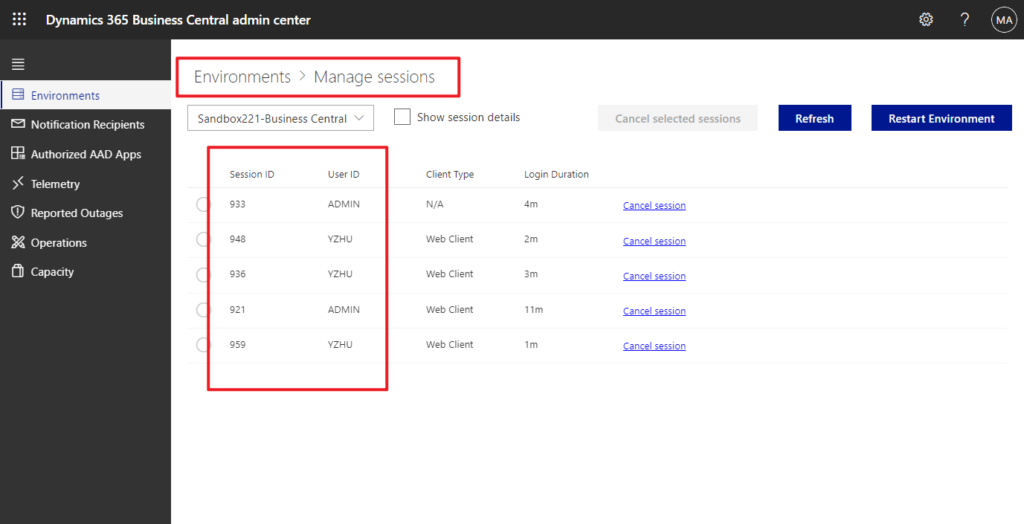
Setting “sessionId” is similar to the above, so I won’t repeat the introduction here. And if you want the exact USER ID and Session ID, you can find them in Environments -> Manage sessions in Business Central Admin Center.
Very nice, give it a try!!!😁
PS:
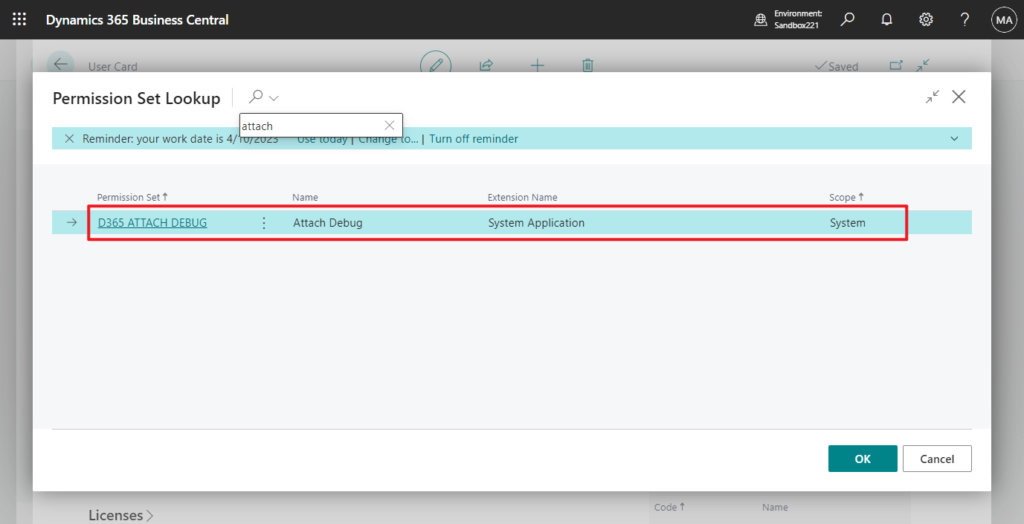
1. A new “Attach Debugging” PermissionSet is available to allow cross-user debugging.
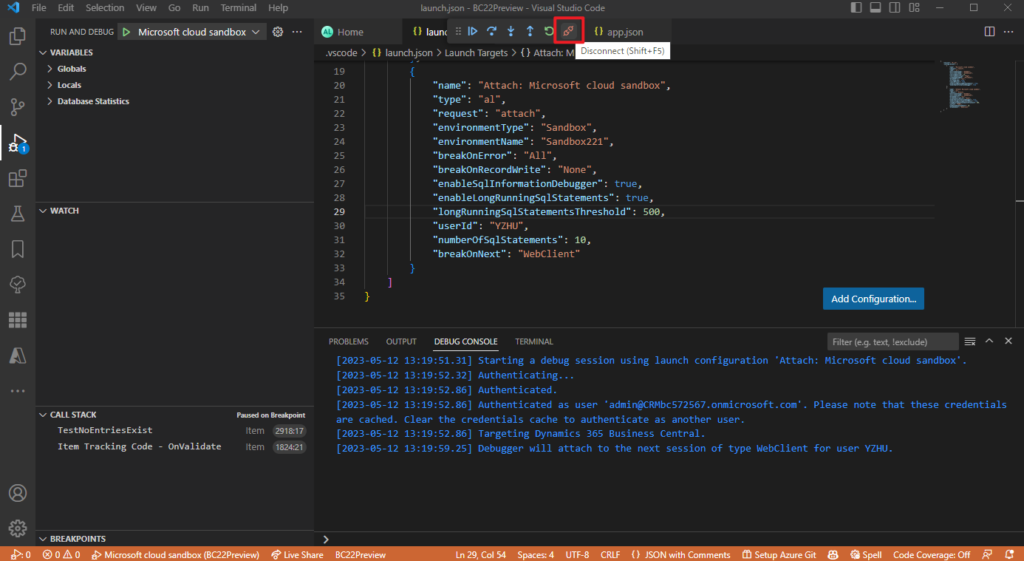
2. If you want to stop debugging, click Run/Continue or Disconnect
Note: when you choose disconnect when the debugger is in the depicted state (at a breakpoint) the process for the end-user will be aborted (and rolled back) with the error- message “The debugger stopped the current activity.” (Except when breakpoint is due to error).
END
Hope this will help.
Thanks for reading.
ZHU
コメント