
Articles in this series:
- Profiling AL performance with snapshot debugger (AL: Generate profile file)
- In-client performance profiler (Performance Profiler page)
- Choose between more sampling intervals for snapshot and in-client profiling
- Set up easier in-client performance profiling with rules (Profiler Schedules)
- View SQL call information in performance profiles
- Allow copying nodes in the profile editor and support for hovering
- Get the current callstack (SessionInformation Data Type)
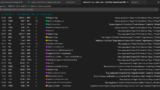
Profiling AL performance with snapshot debugger (AL: Generate profile file)
Profiling AL performance with snapshot debugger (AL: Generate profile file)
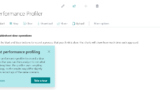
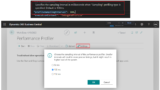
In-client performance profiler (Performance Profiler page)
In-client performance profiler (Performance Profiler page)
Choose between more sampling intervals for snapshot and in-client profiling
Choose between more sampling intervals for snapshot and in-client profiling
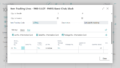
Set up easier in-client performance profiling with rules (Profiler Schedules)
Set up easier in-client performance profiling with rules (Profiler Schedules)

View SQL call information in performance profiles
View SQL call information in performance profiles

Allow copying nodes in the profile editor and support for hovering

Get the current callstack (SessionInformation Data Type)
Get the current callstack (SessionInformation Data Type)


コメント