Hi, Readers.
I attended the Business Central Office Hours Calls (Snapshot Debugging) last night, so today I would like to talk about Snapshot Debugging in Business Central and share some information. Hope this will help.
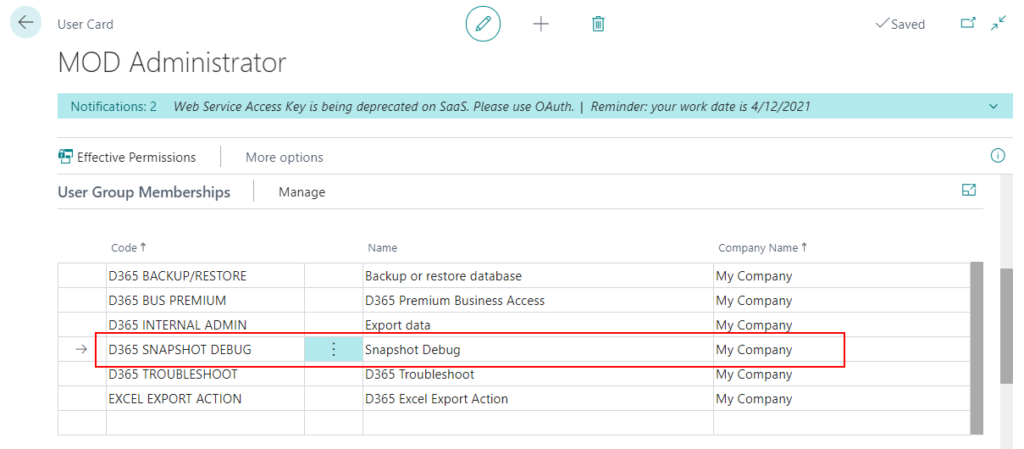
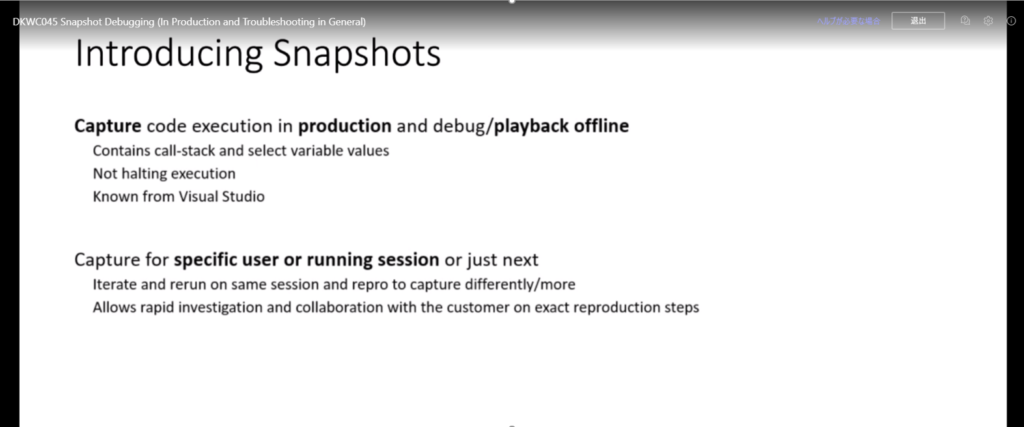
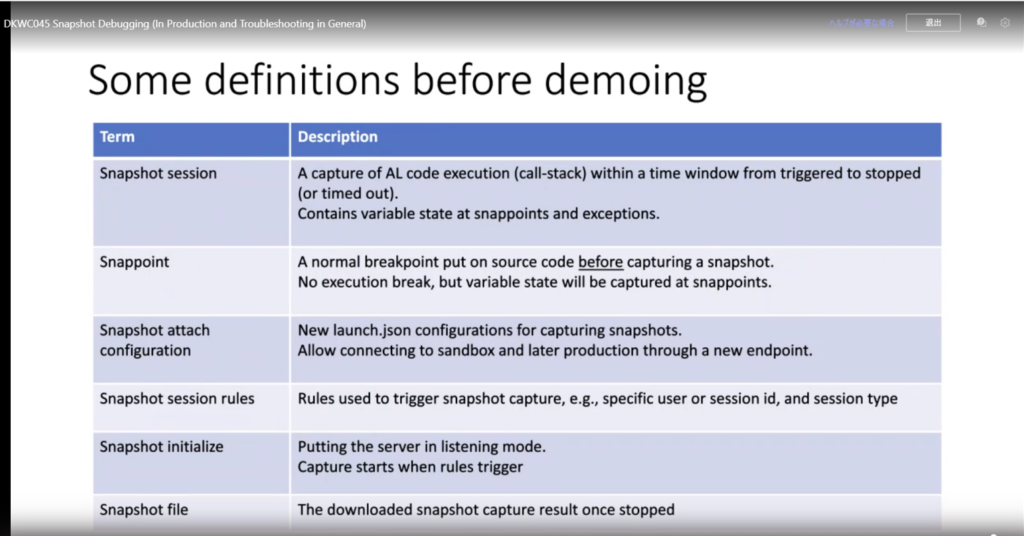
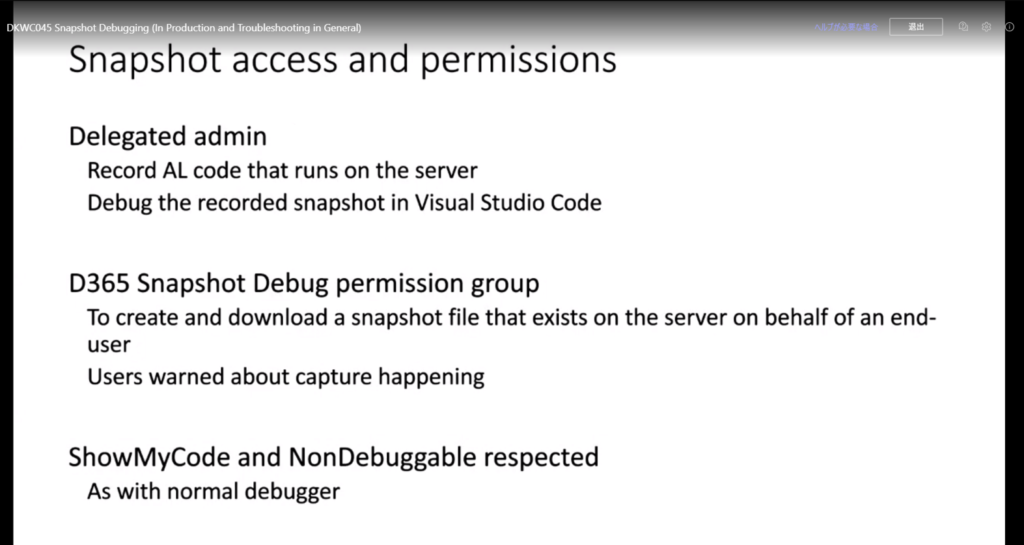
Snapshot debugging allows a delegated admin to record AL code that runs on the server, and once it has run, debug the recorded snapshot in Visual Studio Code. For a delegated admin to create and download a snapshot file that exists on the server on behalf of an end-user, the delegated admin must be part of the D365 Snapshot Debug permission group.
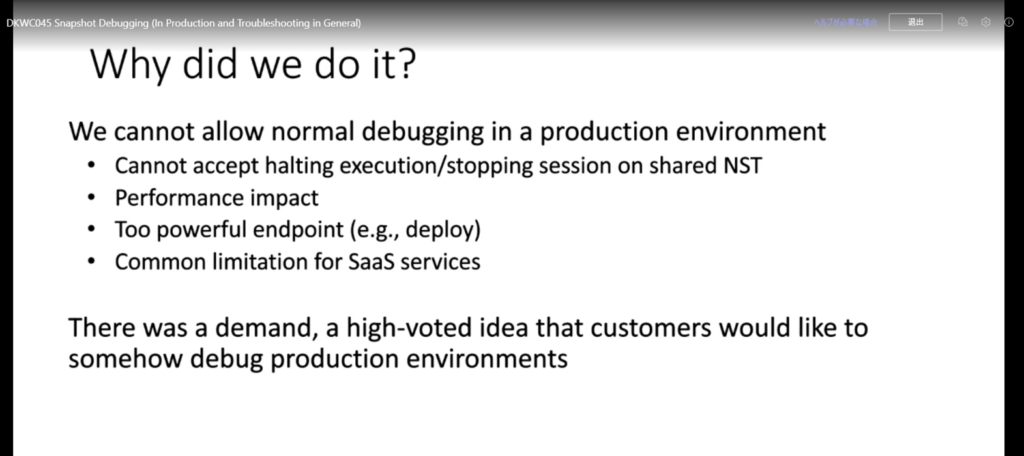
With Business Central 17.2 – Snapshot Debugging is available in production cloud environments.
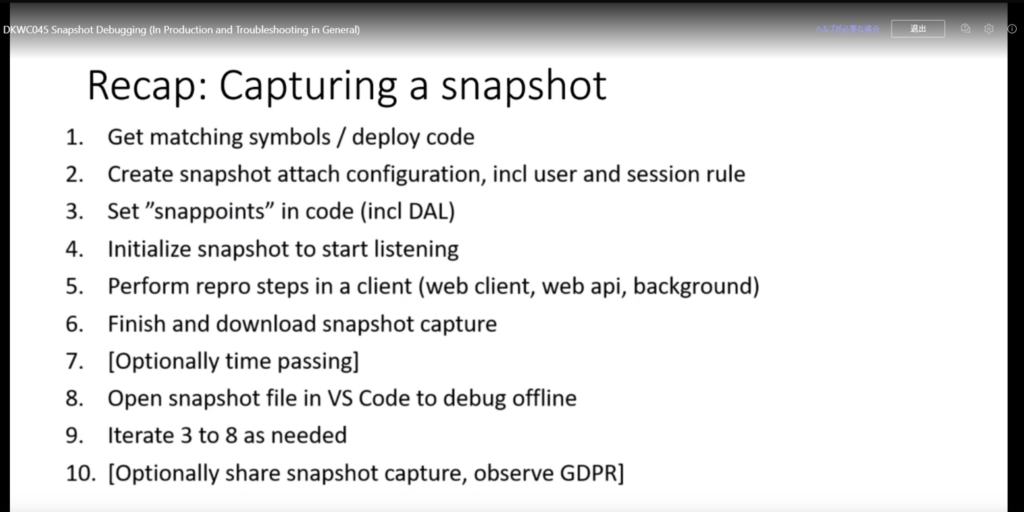
From Visual Studio Code, you start a snapshot by creating a snapshot configuration file. There are two template configurations for a snapshot, which are accessed by selecting Add Configuration in Visual Studio Code.
- AL: Initialize a snapshot debugging session locally
- AL: Initialize a snapshot debugging session on cloud
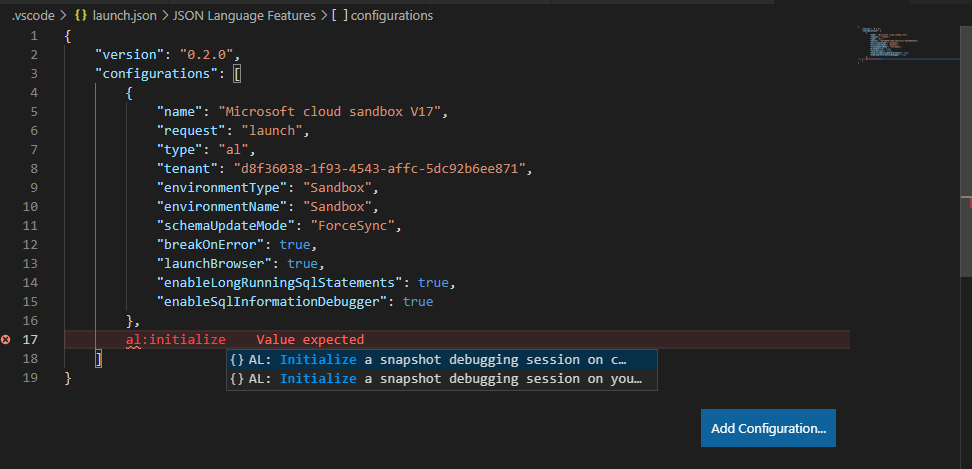
You can choose whether to run the session on a cloud service or locally.
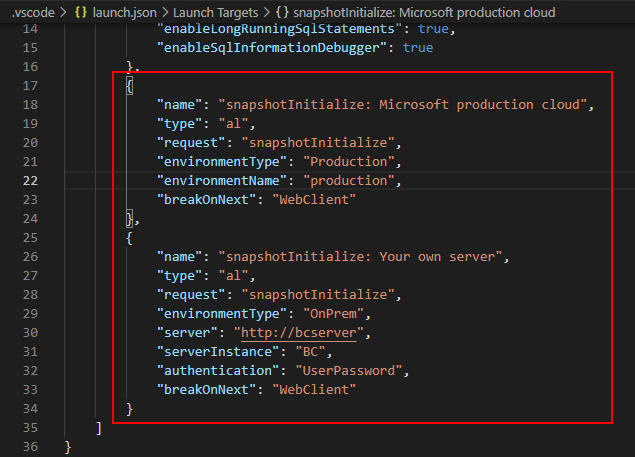
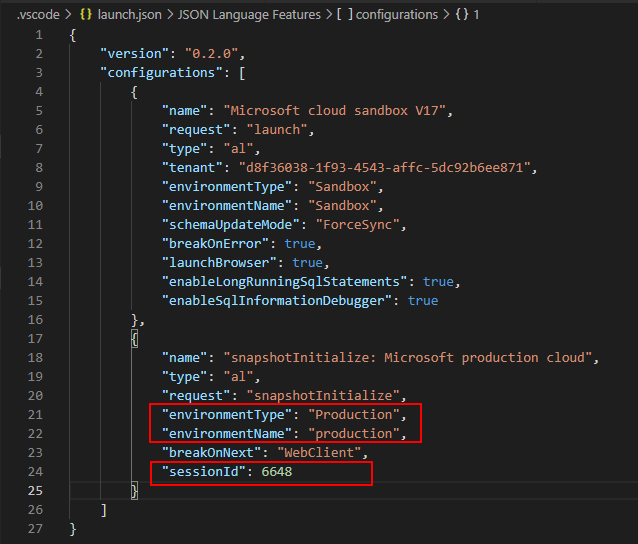
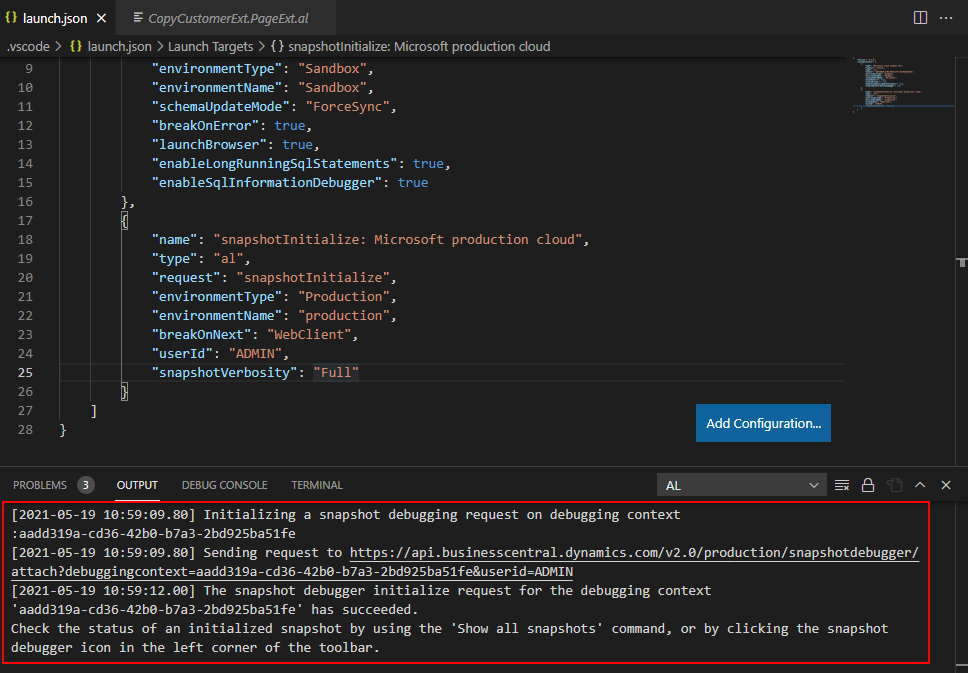
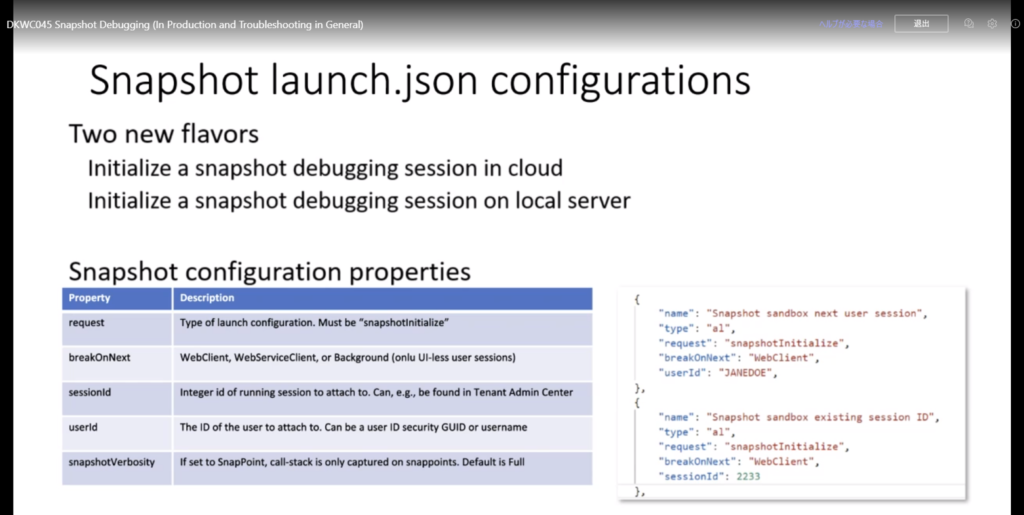
The configuration file will now contain the following information:
| Setting | Description |
|---|---|
userId | The GUID of the user on whose behalf a snapshot debugging will be started. For on-premises, this can also be the user name in user password authentication scenarios. The user must be able to start, or have a session type opened that is specified in the breakOnNext parameter. For more information, see JSON Files. |
sessionId | A session ID for the user specified above in userId. |
snapshotVerbosity | Determines how much execution context to be recorded. If SnapPoint is specified, then only methods that hit a snappoint will be recorded. |
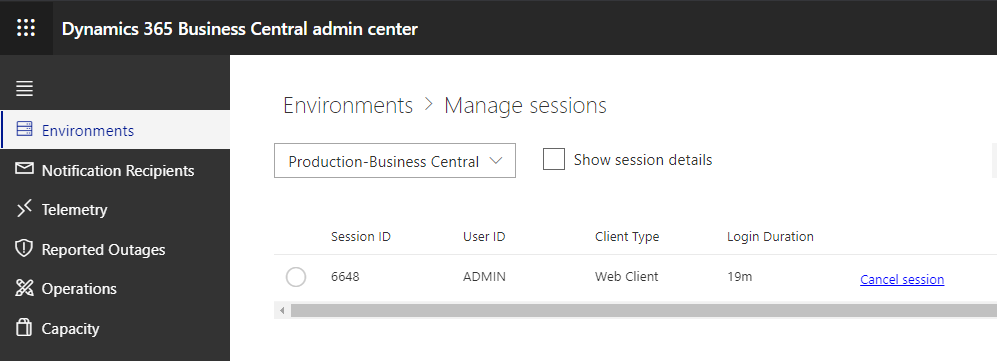
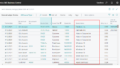
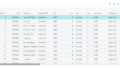
Session ID:
User ID:
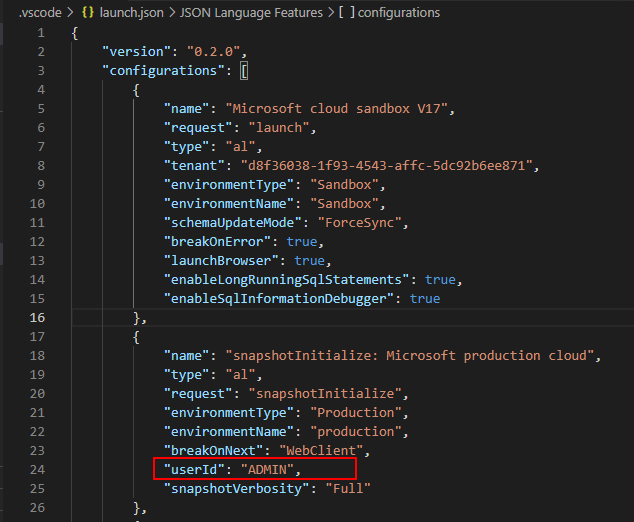
You can get the session ID and User ID in Business Central admin center.
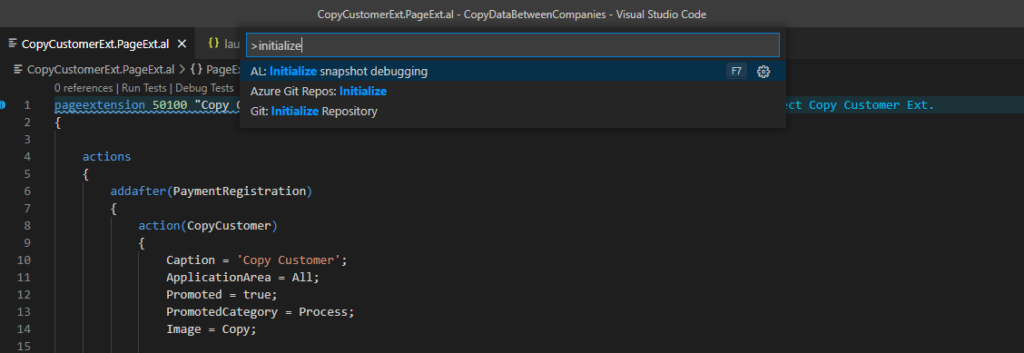
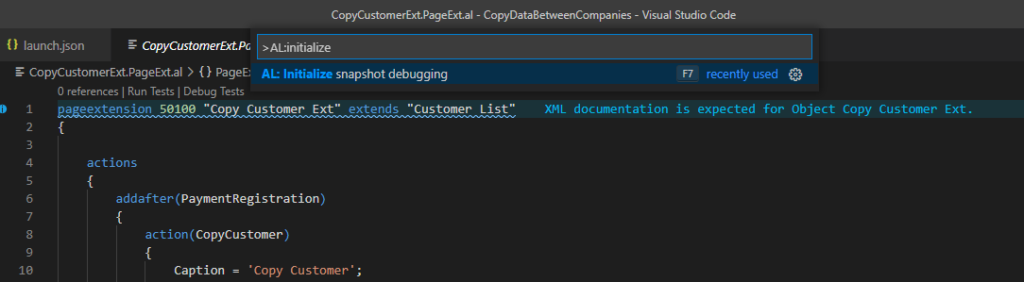
When a configuration is defined, a snapshot debugging session can be initialized by pressing Ctrl+Shift+P and then selecting AL: Initialize Snapshot Debugging or by pressing F7.
Snapshot debugging keyboard shortcuts:
| Keyboard Shortcut | Action |
|---|---|
| F7 | Start a snapshot debugging session |
| Shift+F7 | List all available snapshots |
| Alt+F7 | Finish a snapshot debugging session |
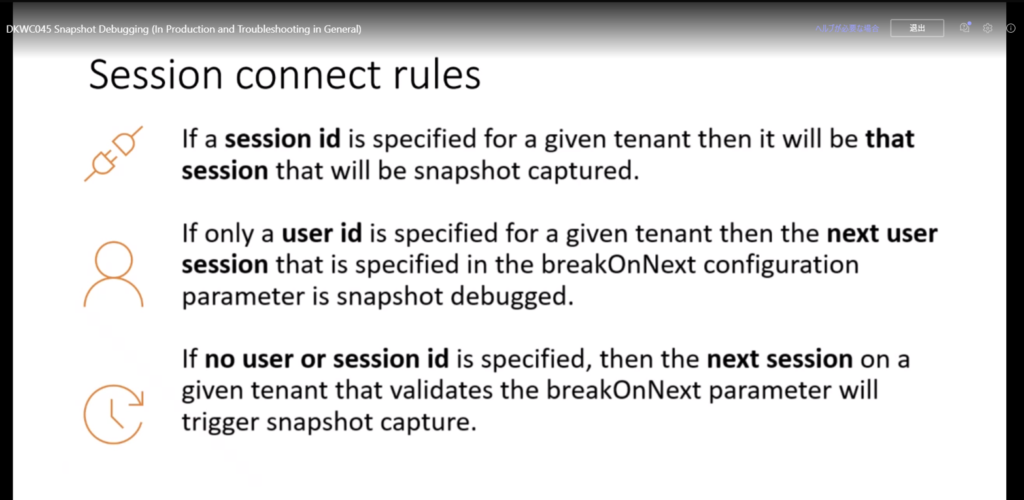
To record the AL execution, the server will now wait for a connection to happen where the following rules apply:
- If a
sessionIdis specified for a userId for a given tenant then it will be that session that will be snapshot debugged. - If only a
userIdis specified for a given tenant then the next session that is specified in thebreakOnNextconfiguration parameter is snapshot debugged. - If no
userIdis specified then the next session on a given tenant that validates thebreakOnNextparameter will be snapshot debugged.
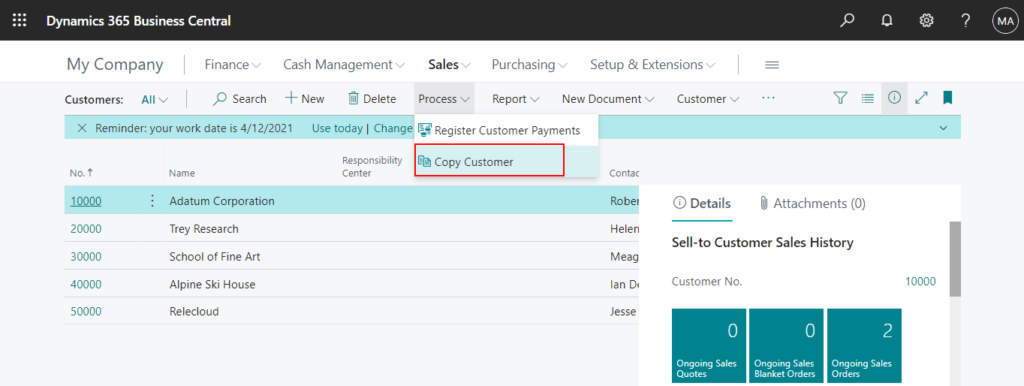
Okay, let’s try it.
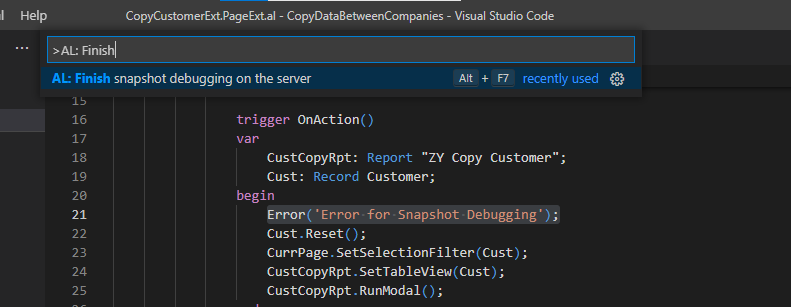
The following is my test code.
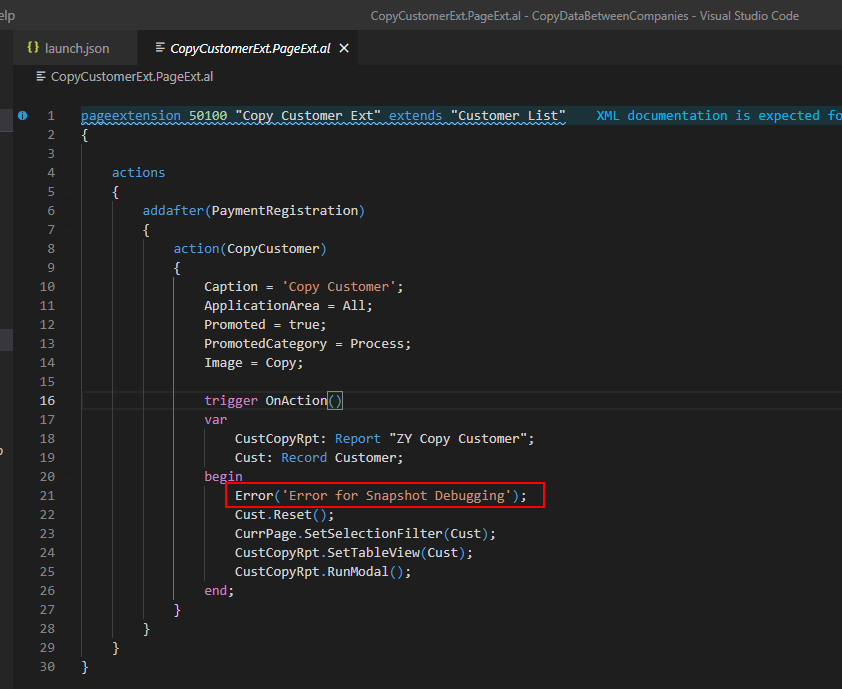
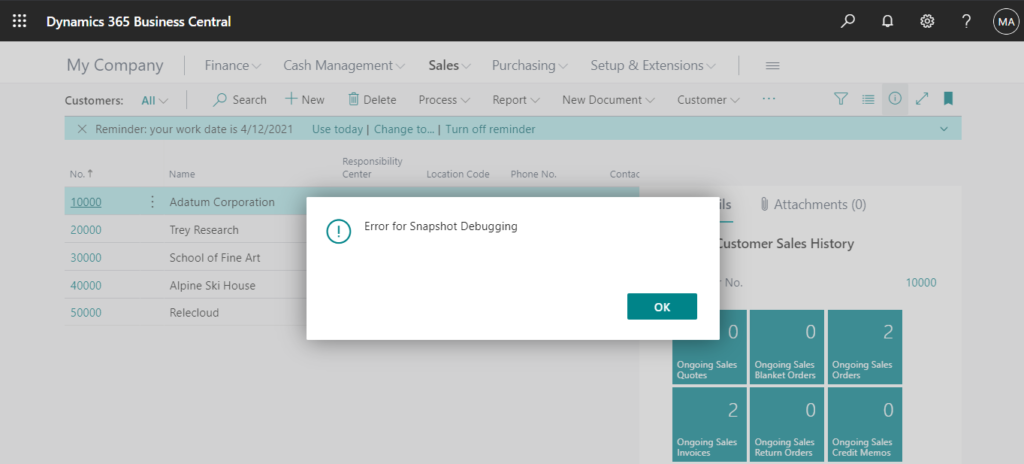
If you choose Copy Customer, you will get a error.
Go back to VS Code, pressing Ctrl+Shift+P and then selecting AL: Initialize Snapshot Debugging or by pressing F7.
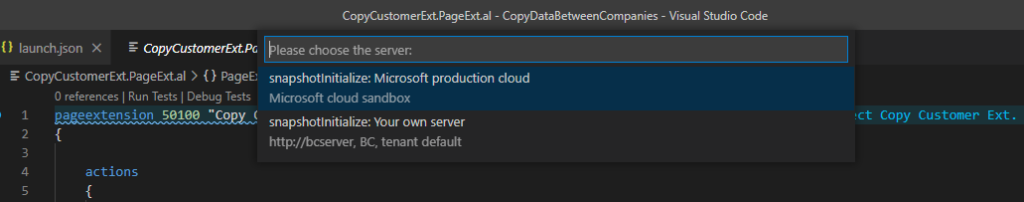
Choose the snapshotInitialize set in launch.json. (If there is only one, no need to choose)
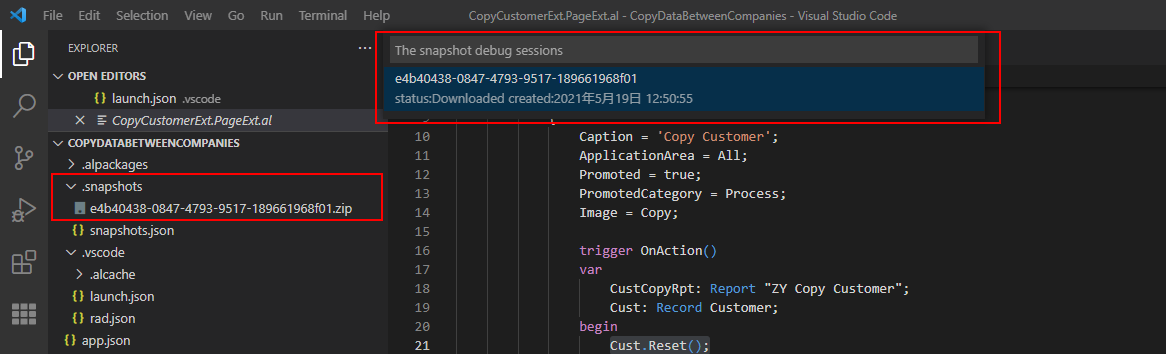
The number after the debug icon on the status bar will be 1, and if you click on this icon (or pressing Shift + F7) a list of available snapshots is listed:
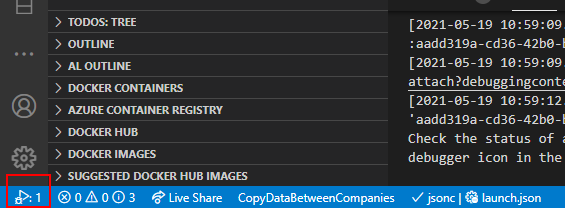
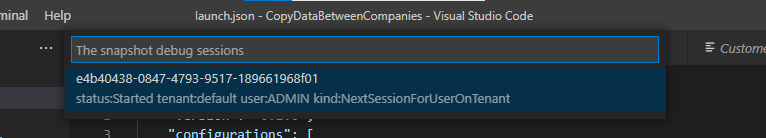
Select it to start the snapshot debugging session.
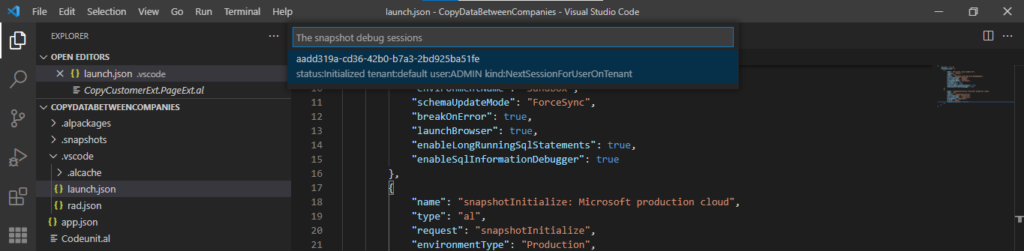
Initialized -> Started
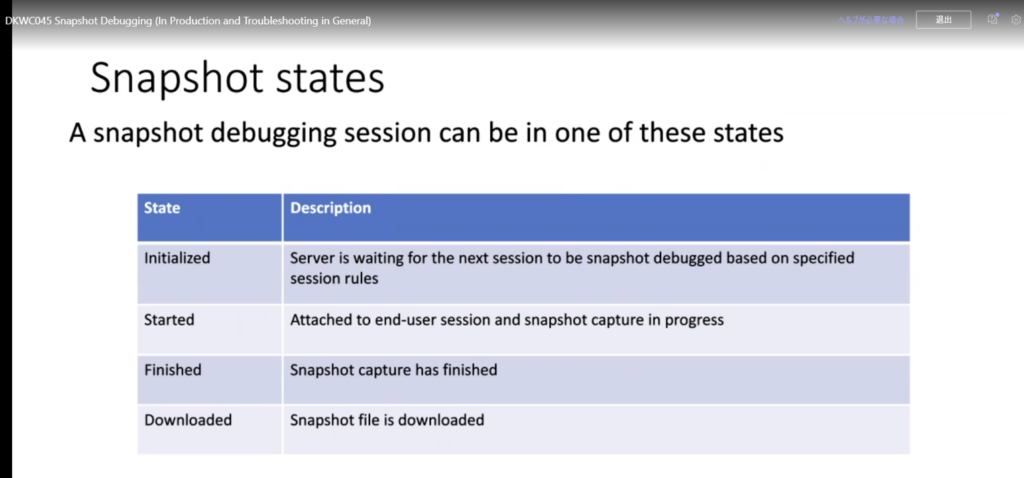
PS: Status of a snapshot debugging session
- Initialized – A request is issued and the server is waiting for the next session to be snapshot debugged based on the above rules.
- Started – You have attached to an end-user session to snapshot debug.
- Finished – When the snapshot debugging session has finished.
- Downloaded – When the snapshot file is downloaded.
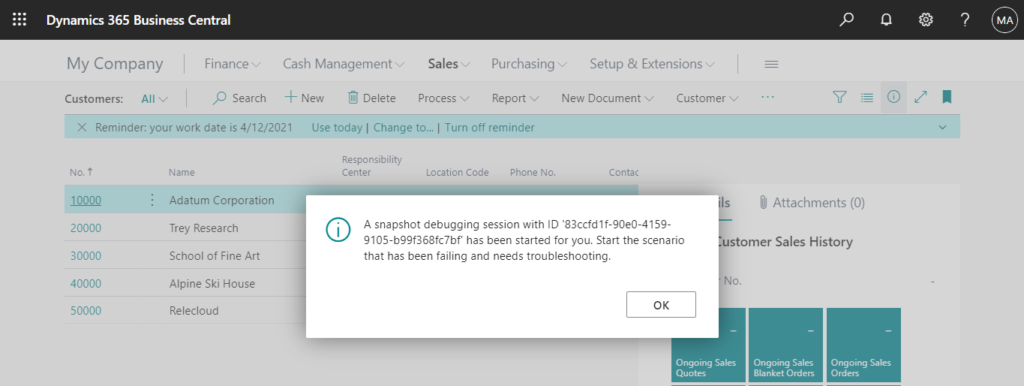
Now, you can go back to Business Central to start the scenario that has been failing and needs troubleshooting.
When the scenario is finished, you can press Ctrl+Shift+P and then select AL: Finish snapshot debugging on the server or by pressing ALT + F7.
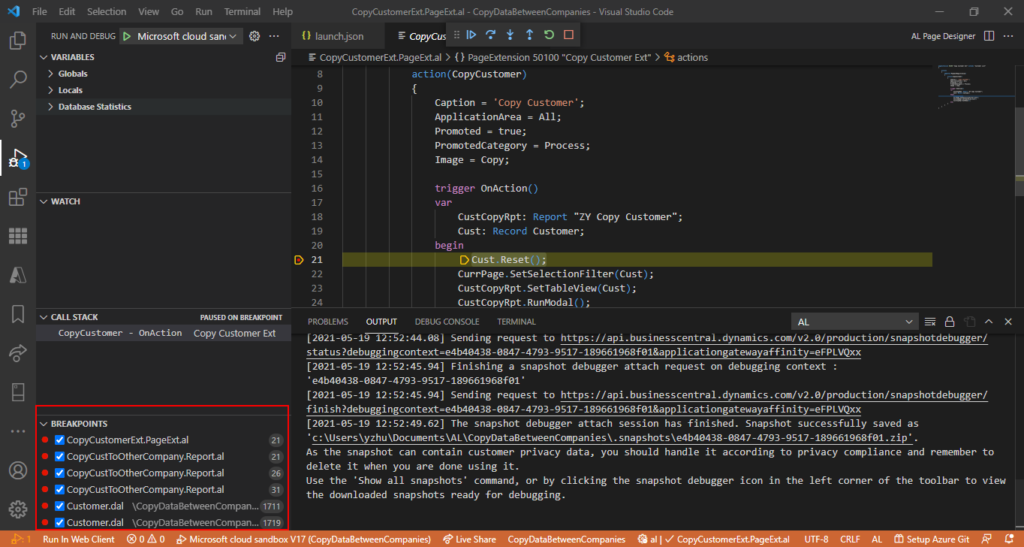
The snapshot is downloaded as a ZIP file to the .snapshots folder in your VS Code project. And the debug icon on the status bar will be orange now.
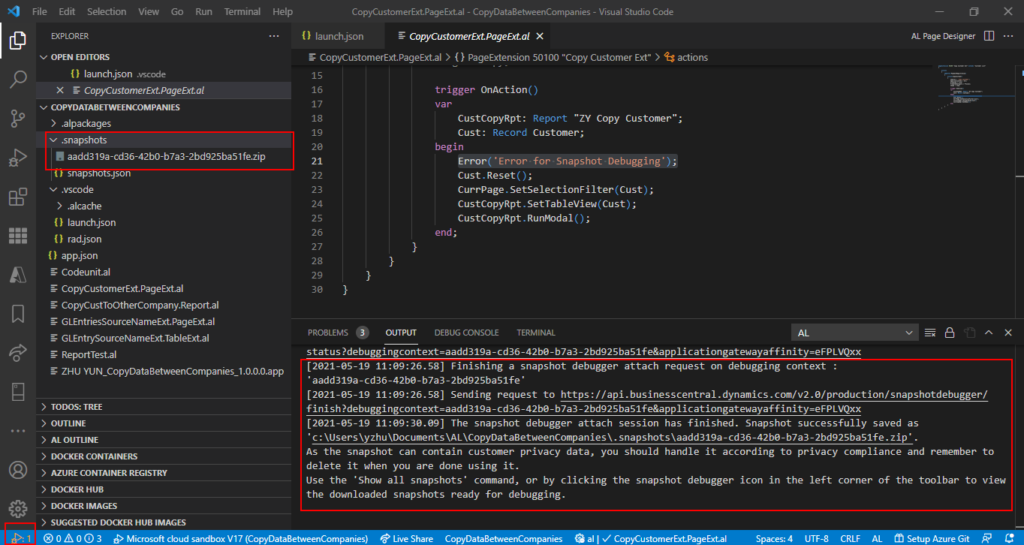
By clicking on debug icon, you can see the list of the downloaded snapshots.
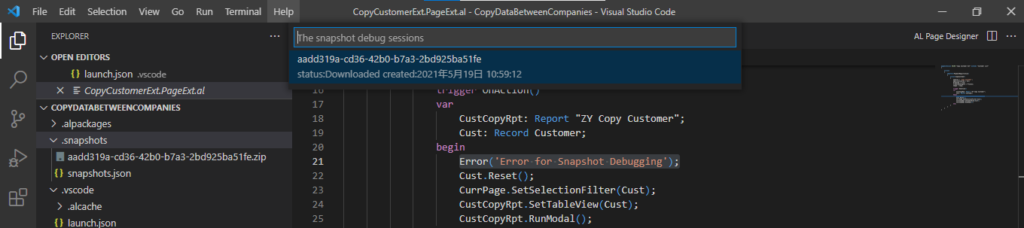
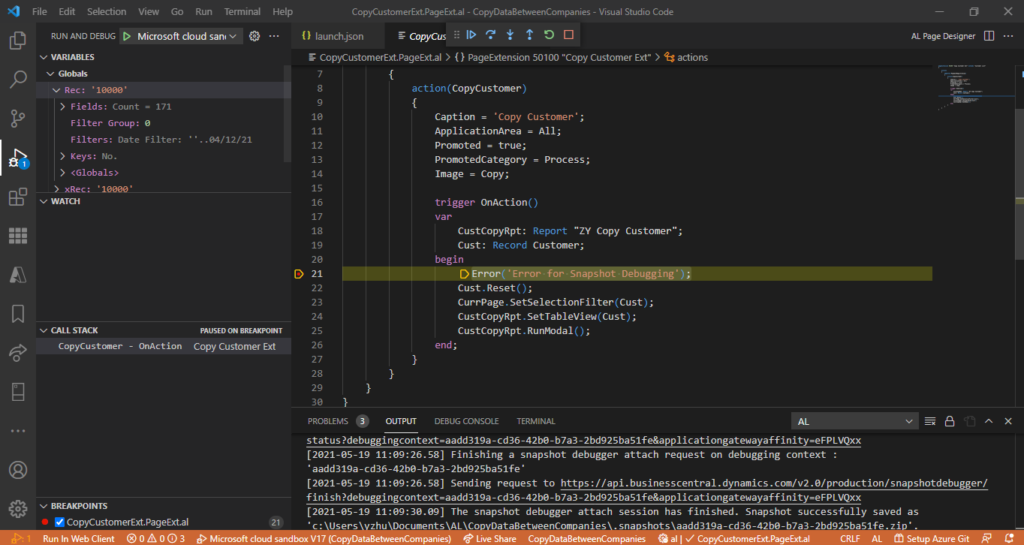
Select the snapshot and start the Snapshot Debugging:
Complete Test Video:
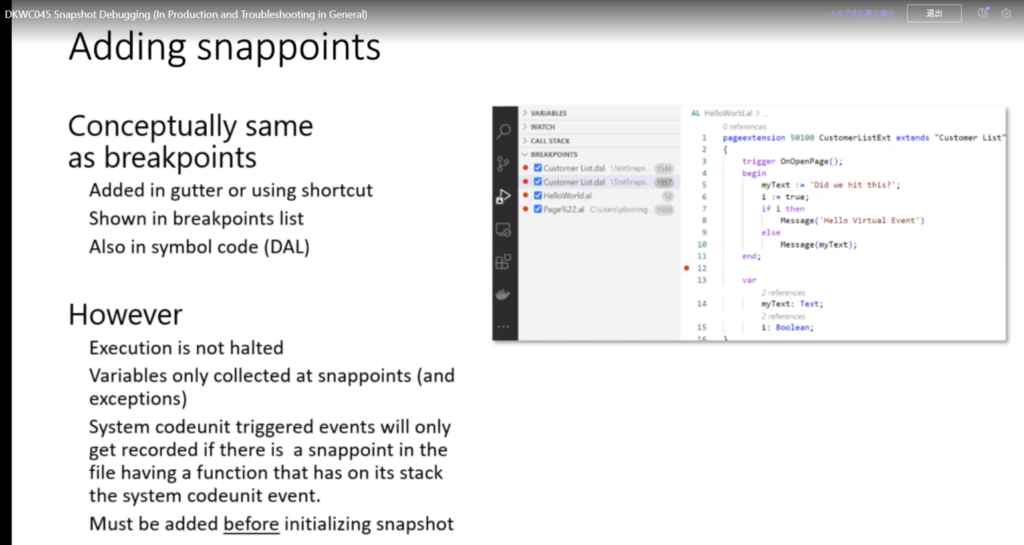
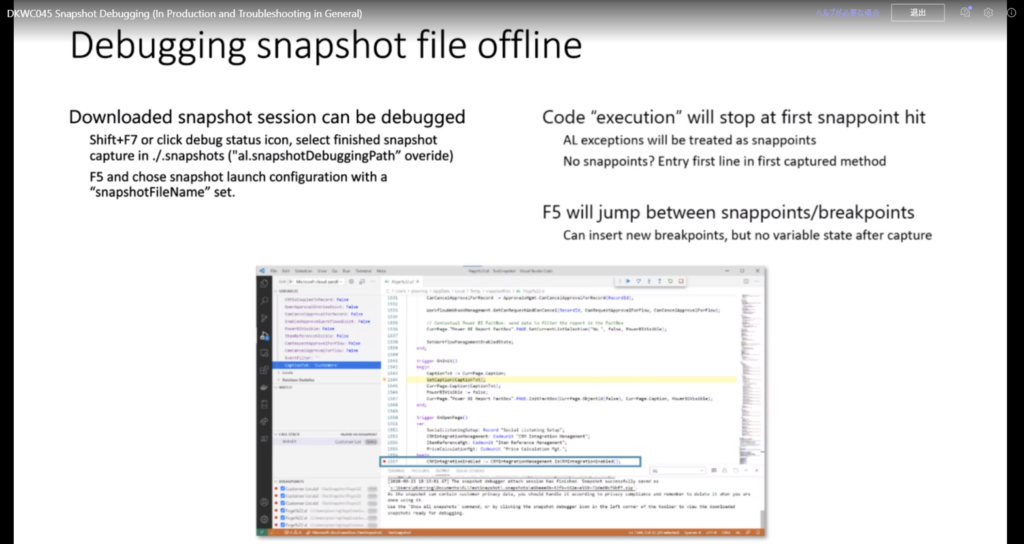
PS: Breakpoints can be added and removed and they will be hit if given a breakpoint; the breakpoint is in the execution context of a recorded state. This means that if walking the execution stack for a breakpoint and the next stepped line is reached, then the code will break on the breakpoint.
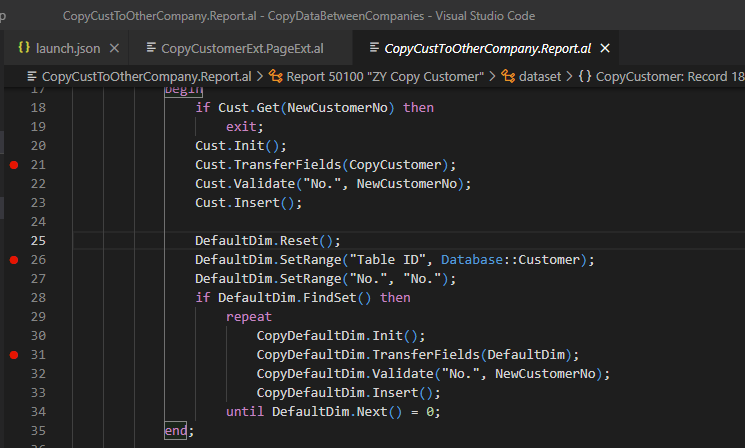
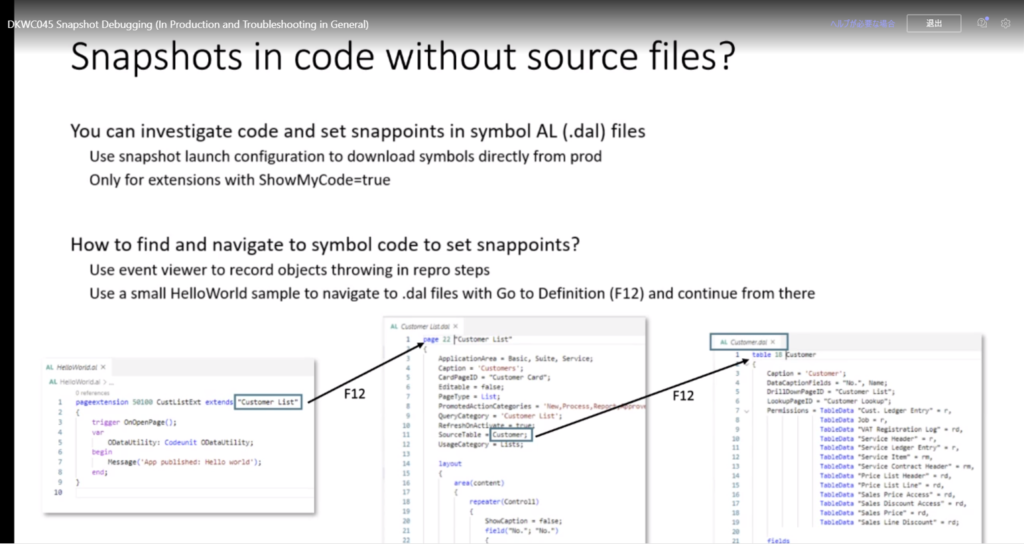
You can also set breakpoints in Base Application (dal file).
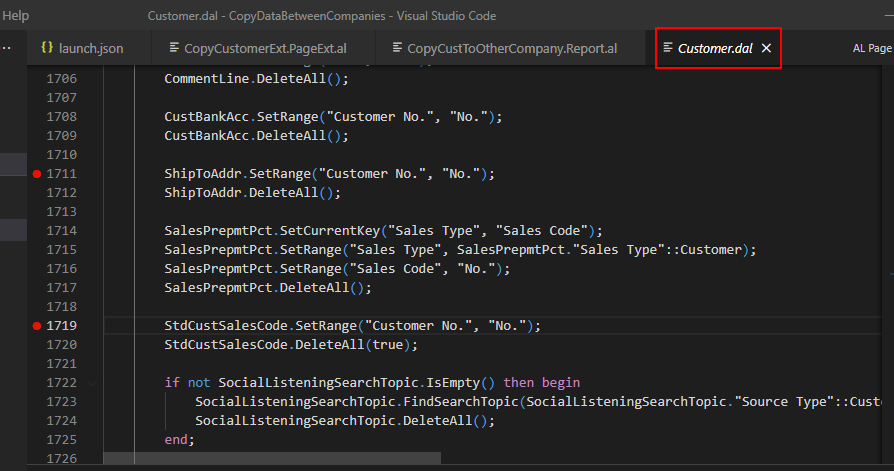
For example:
Information about Snapshot Debugging from Microsoft: You can also find the latest recordings here: https://aka.ms/BCOfficeHoursRecordings (allow for up to 48 hours for it to be accessible)
Find out more about Snapshot Debugging from Microsoft Docs.
You can view the session on Visual Studio Code and AL from Release wave 2 2020 prior to the call: Dynamics 365 Partner Portal (microsoft.com).
Update 2022/09/12: Business Central 2022 wave 2 (BC21) new features: Visualize code lines executed in snapshot capture (Snapshot Debugger Lines Hit Decoration)
END
Hope this will help.
Thanks for reading.
ZHU
コメント