Hi, Readers.
Today I would like to share another mini tip about Business Central, how to analyze performance issues using the page inspector.
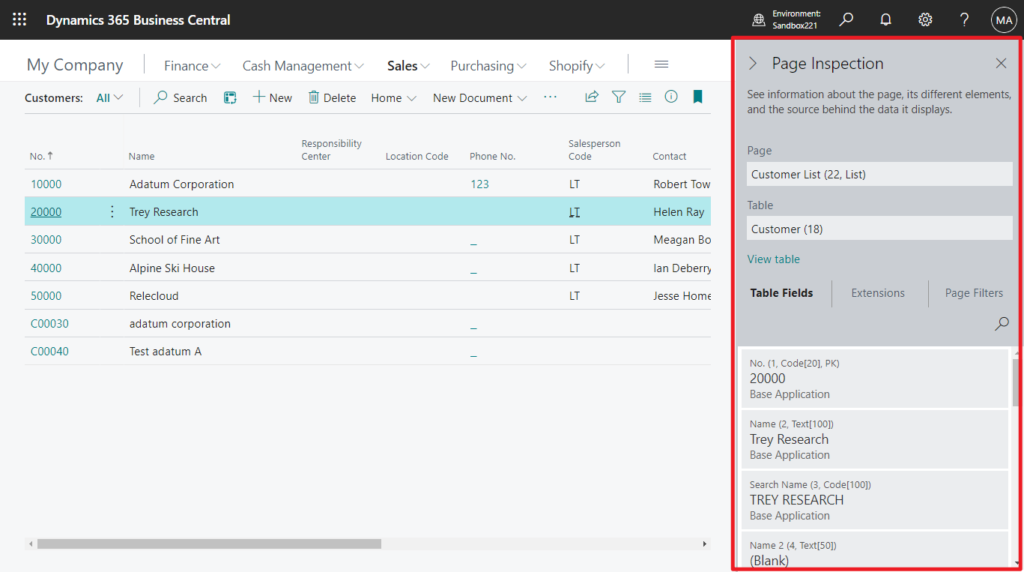
The page inspection feature in Business Central enables you to get details about a page, providing insight into the page design, the different elements that comprise the page, and the source behind the data it displays.
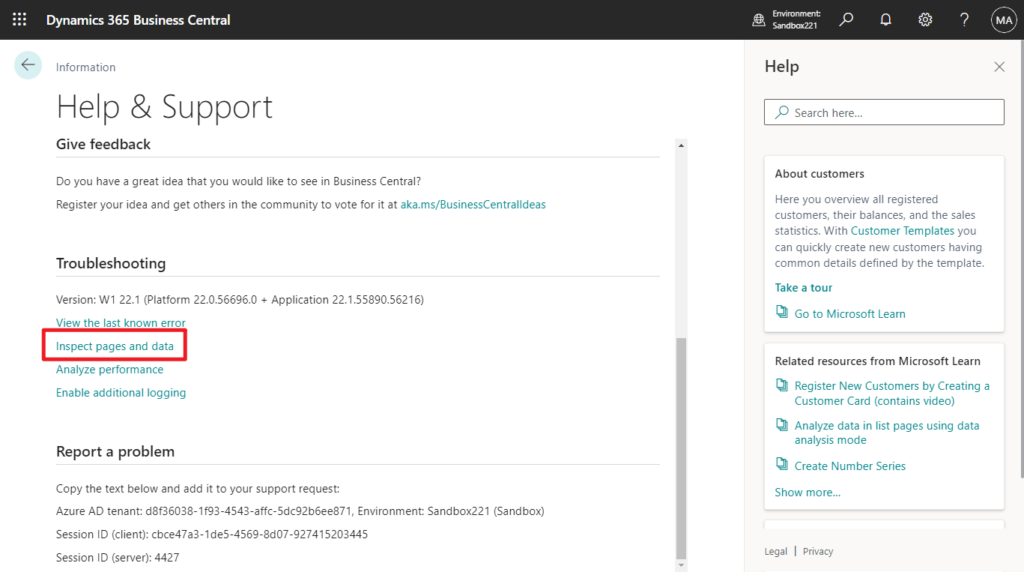
You can start page inspection from the Help & Support page. Choose the question mark in the top right corner, choose Help & Support, and then choose Inspect pages and data.
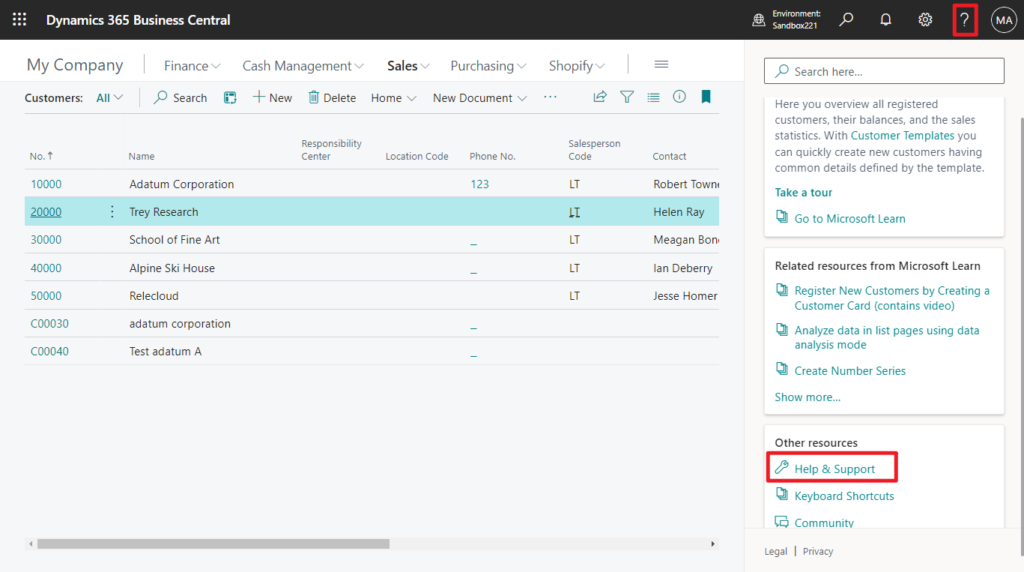
Or, you can just use the keyboard shortcut Ctrl+Alt+F1.
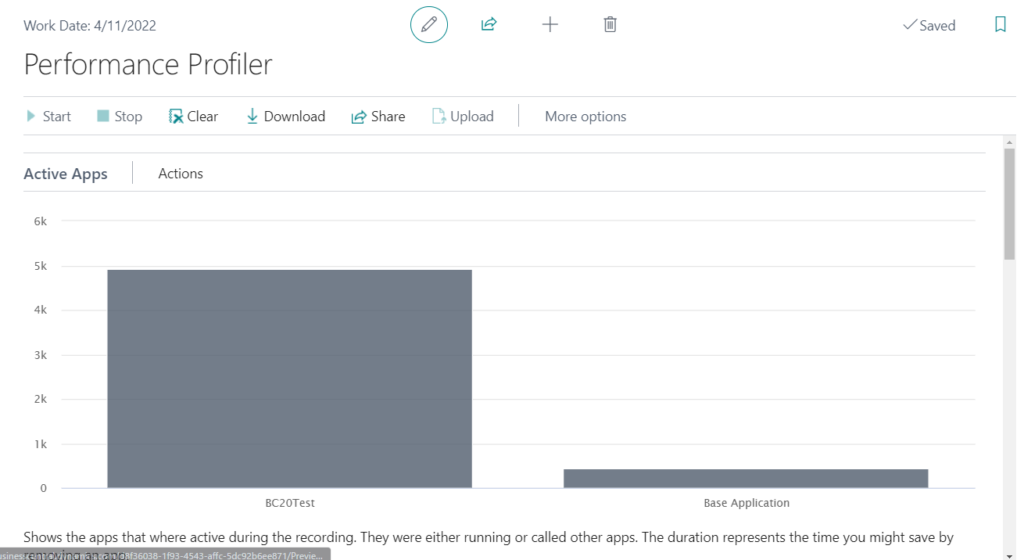
If a specific page takes too long to load, it might be due to extensions that are adding expensive operations to the page triggers. Although you can use the performance profiler’s related features. More details: Dynamics 365 Business Central Blog Series: Performance Profiler
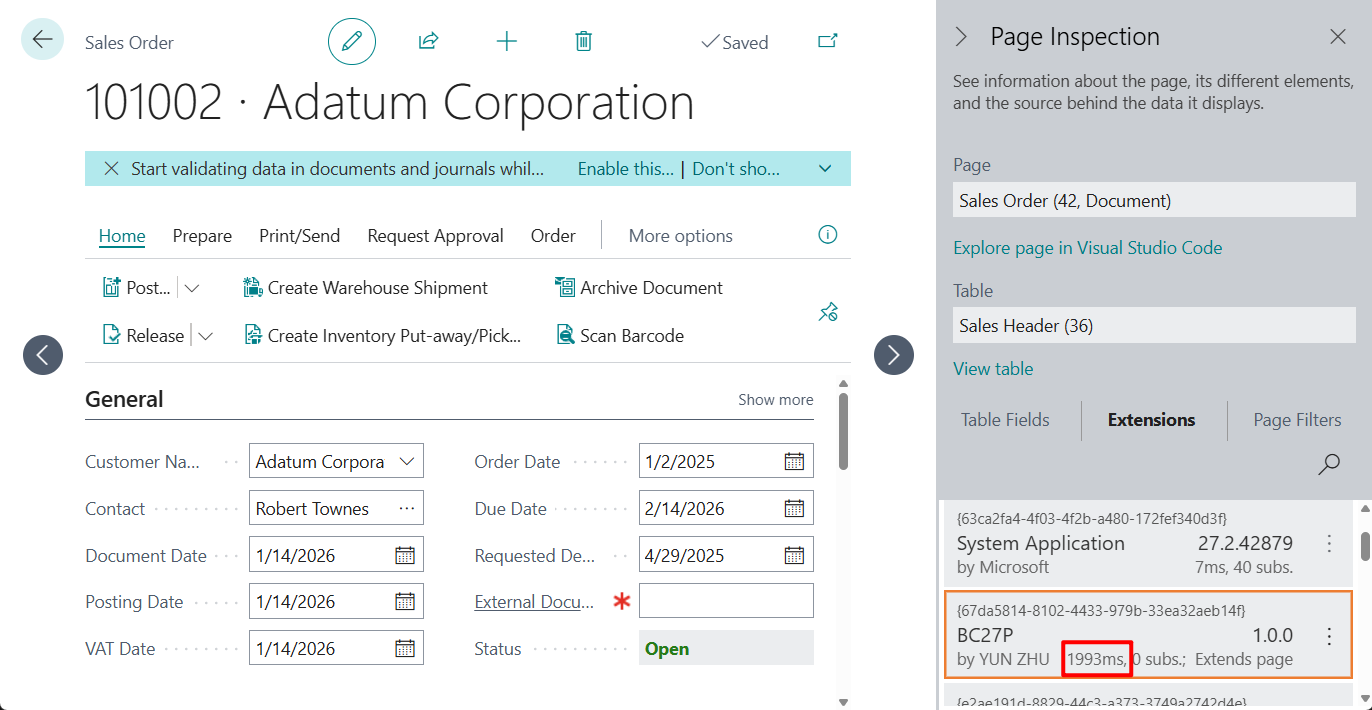
If you don’t need that much detailed information, you can just use the page inspector to analyze this performance by navigating to the Extensions tab.
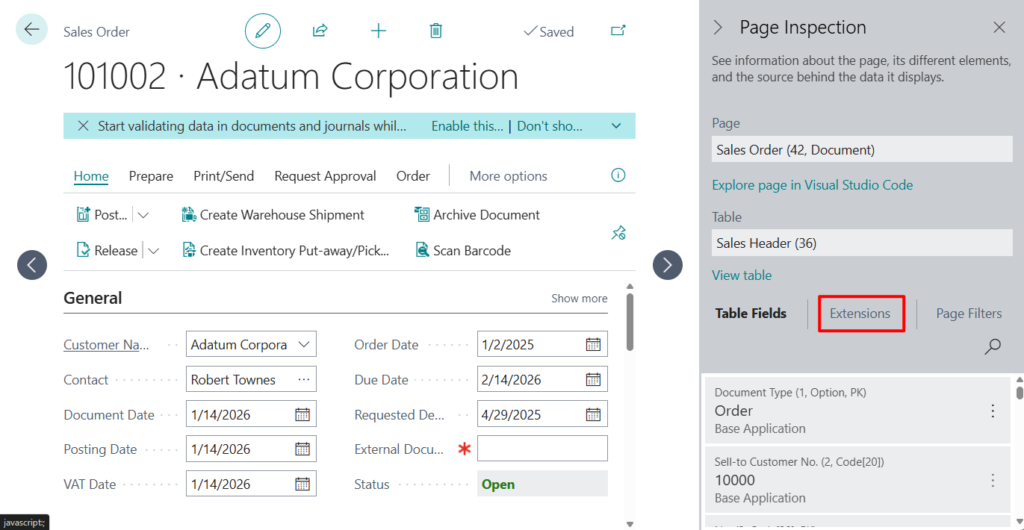
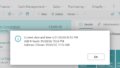
t displays installed extensions that affect the selected page or its source table by showing the time (in milliseconds) it took to run the extension in the call stack and the number of event subscribers run in the extension.
What Page Inspection Shows: The Extensions tab displays installed extensions that affect the selected page or its source table.
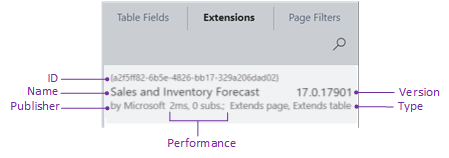
There are four different extension types:
- Adds page indicates that the extension adds the page object.
- Extends page indicates that the extension modifies the page, like adding a field, action, or code. In AL, these modifications are done by a page extension object.
- Adds table indicates that the extension adds the table object.
- Extends table indicates that the extension modifies the source table, like adding a field or code. In AL, these modifications are specified by a table extension object.
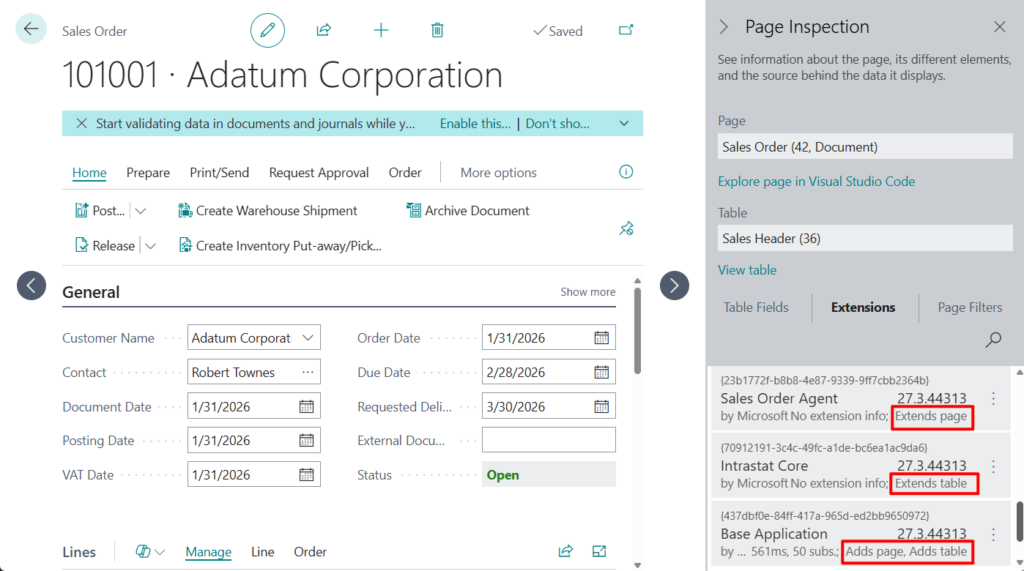
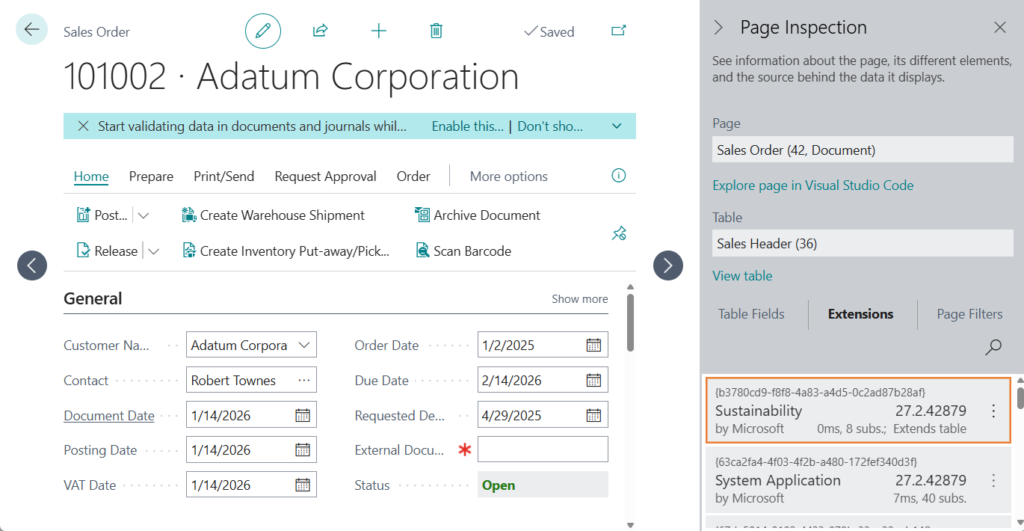
The performance information includes two values. The first value indicates the time (in milliseconds) it took to run the extension in the call stack. The second value indicates the number of event subscribers run in the extension.
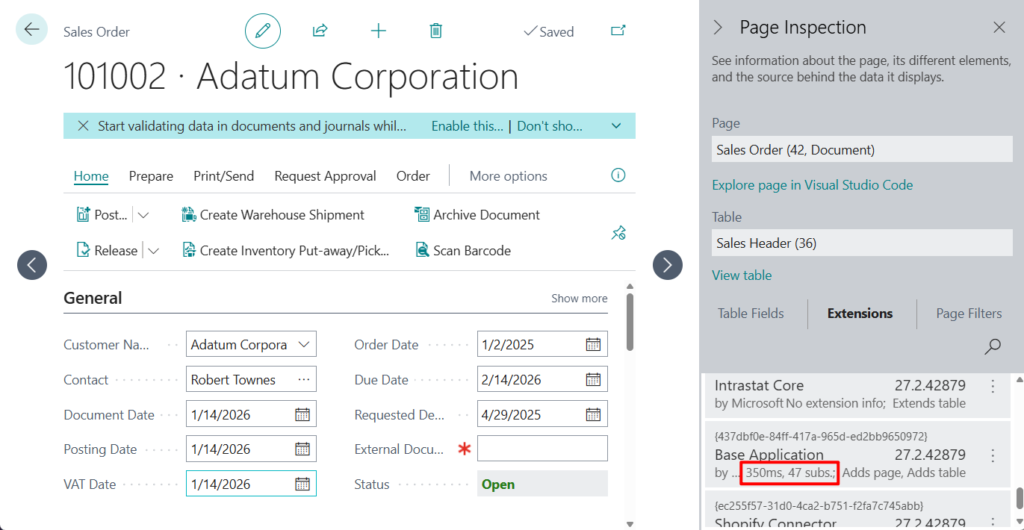
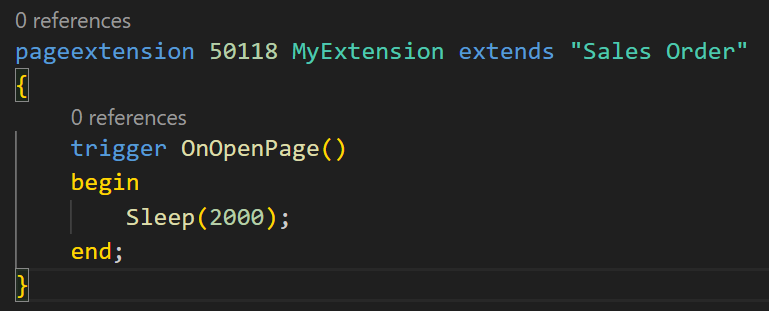
Let’s look at a very simple example.
Great.

Give it a try!!!😁
PS:
1. Performance articles for developers
2. Analyzing performance issues using the page inspector
END
Hope this will help.
Thanks for reading.
ZHU
コメント