Hi, Readers.
The public preview for Dynamics 365 Business Central 2026 release wave 1 (BC28) is available. Learn more: Link.
I will continue to test and share some new features that I hope will be helpful. In this post, I would like to talk about Get item insights with advanced KPIs and Summary.
Get item insights with advanced KPIs and Summary:
Copilot gives you faster and more comprehensive item summaries with new KPIs and data points from the new Item Statistics page.
https://learn.microsoft.com/en-us/dynamics365/business-central/dev-itpro/whatsnew/preview-feature-details?wt.mc_id=DX-MVP-5004336#get-item-insights-with-advanced-kpis-and-summary
In Business Central, items are the goods and services that a company trades in. Item cards hold the information that is required to buy, store, sell, deliver, and account for items.
With this wave (BC28), Microsoft has brought us a new page that allows us to analyze items, Item Statistics page.
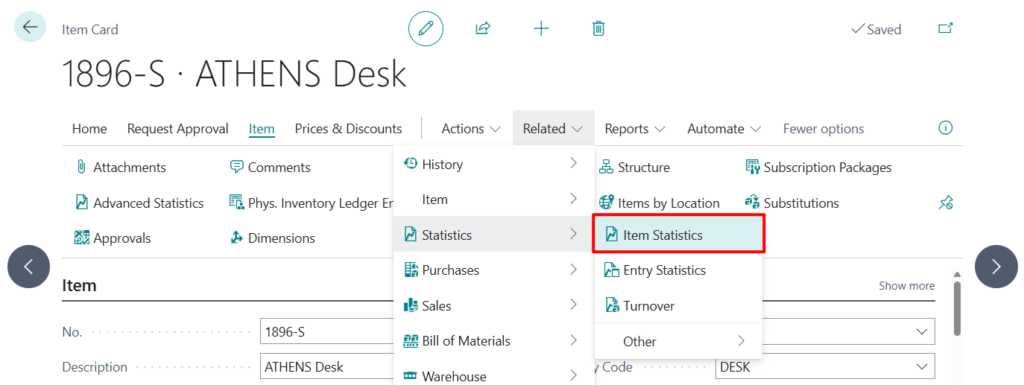
You can find and open it from the Item Card. Choose Related -> Statistics -> Item Statistics
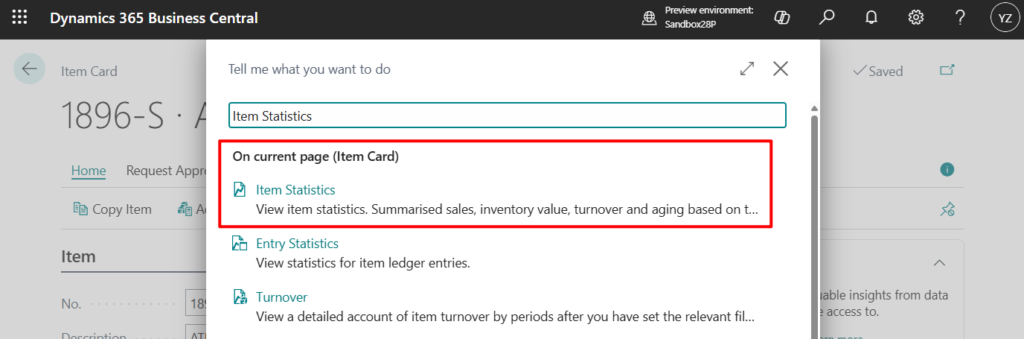
Or search for “Item Statistics” directly in Tell Me on the Item Card page.
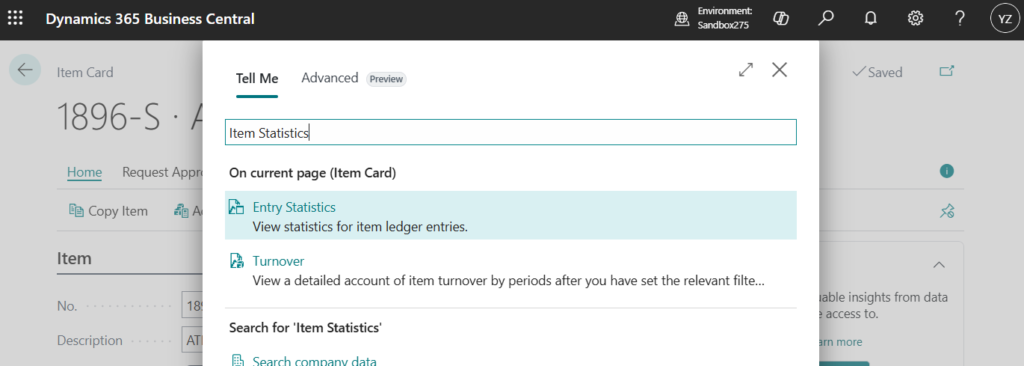
PS: In BC27 and previous versions
Item Statistics page:
Below is a detailed introduction from Microsoft:
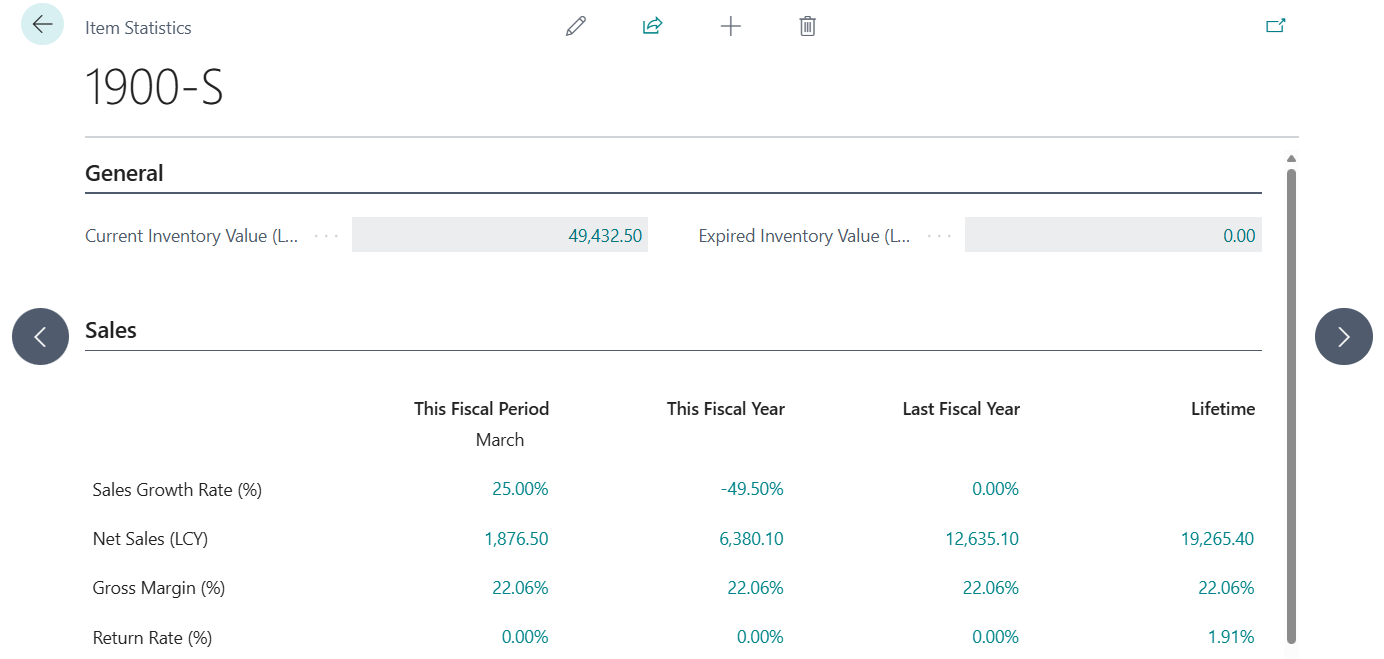
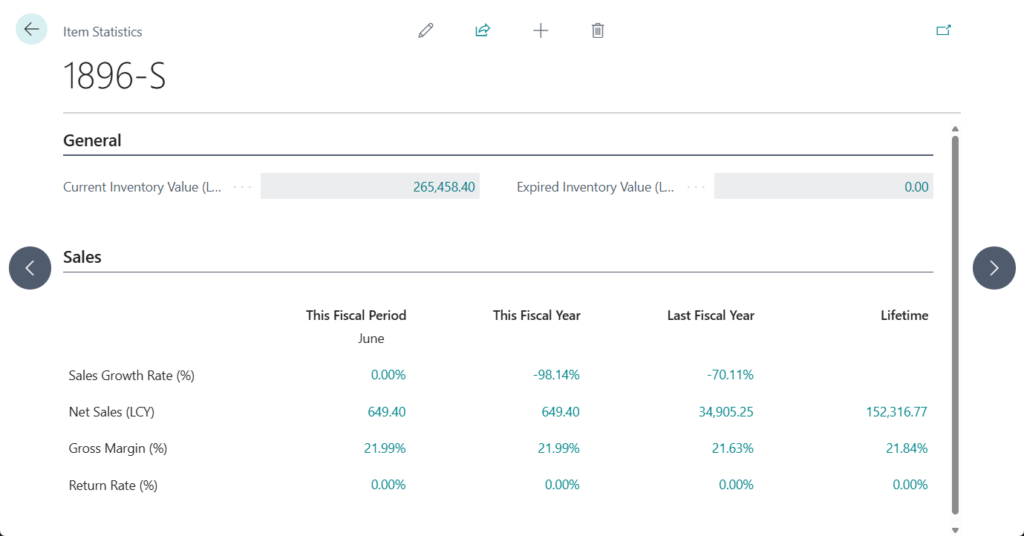
The Item Statistics page provides financial and performance metrics for an item across different time periods.
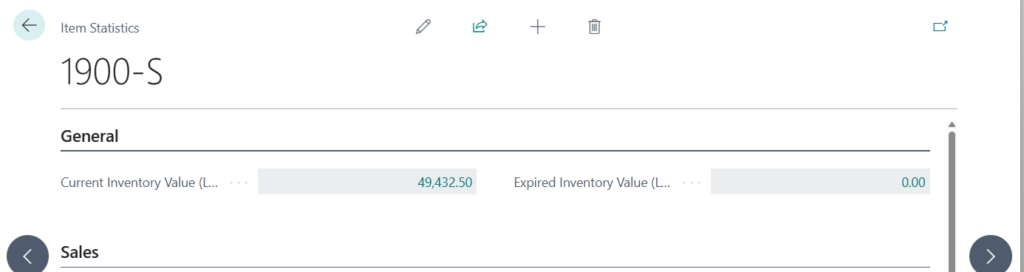
- Current Inventory Value: Track the current inventory value (in local currency), calculated as the sum of Cost Amount (Actual) + Cost Amount (Expected) on posted Value Entries for this item.
- Expired Inventory Value: Identify obsolete stock for timely action. Applicable for items with enabled item tracking and expiration dates. Calculated as the sum of Cost Amount (Actual) + Cost Amount (Expected) from Value Entries applied to open Item Ledger Entries with Expiration Date before the Work Date.
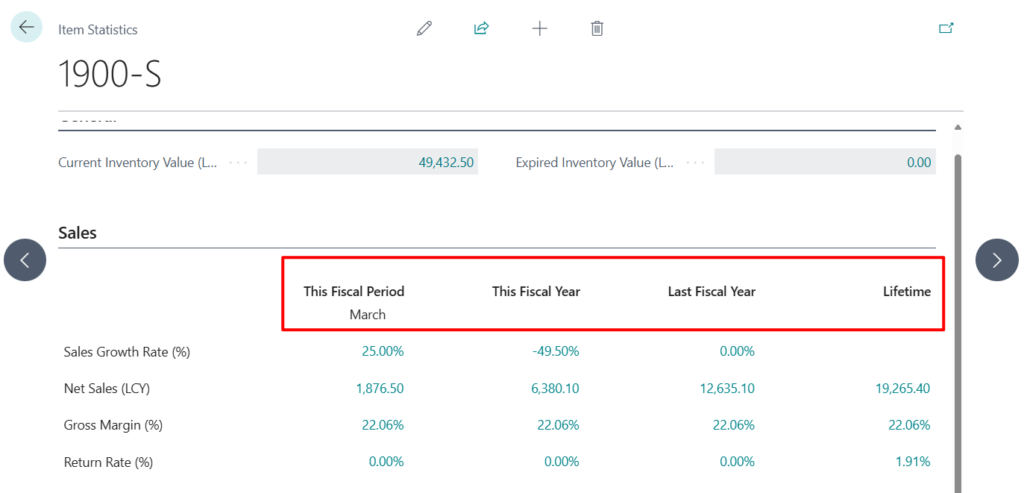
The Sales section displays four time period columns with multiple metrics per period.
Time periods:
- This Fiscal Period – Current accounting period in the fiscal year
- This Fiscal Year – Current fiscal year to date
- Last Fiscal Year – Previous fiscal year
- Lifetime – All transactions since the item was created
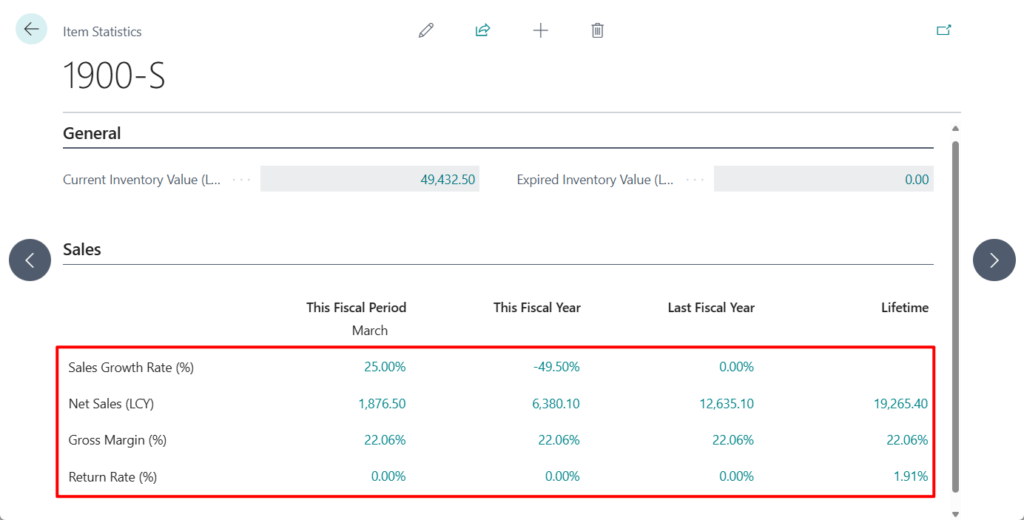
Sales Metrics:
- Sales Growth Rate (%): Compare current and prior periods to identify demand trends. Calculated as (Sales in the current period in the fiscal year – Sales in the prior period in the fiscal year) ÷ Sales in the prior period in the fiscal year. A positive value indicates growth, while a negative value indicates a decline in sales.
- Net Sales (LCY): View actual revenue after returns and discounts. Calculated as Total sales in the period – Total returns – Total given discounts.
- Gross Margin (%): Assess profitability by comparing revenue to cost of goods sold. Calculated as((Net Sales – COGS) ÷ Net Sales. A higher percentage reflects better profitability.
- Return Rate (%): Monitor product quality and customer satisfaction through return ratios. Calculated as Returned Quantity ÷ Total Sold Quantity. A lower percentage indicates fewer returns and higher product acceptance.
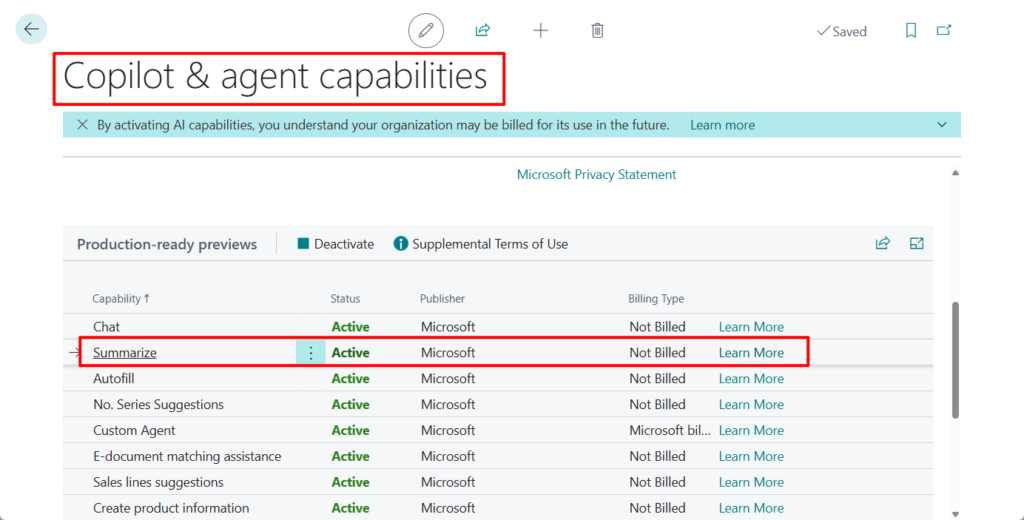
When you turn on the Summarize with Copilot capability, you automatically enable these enhancements. More details: Business Central 2025 wave 1 (BC26): Summarize with Copilot (New capability of Copilot)
Great. Give it a try!!!😁
END
Hope this will help.
Thanks for reading.
ZHU

コメント